Content
Published:
This is an archived release.
Prices of office properties up 6.8 per cent
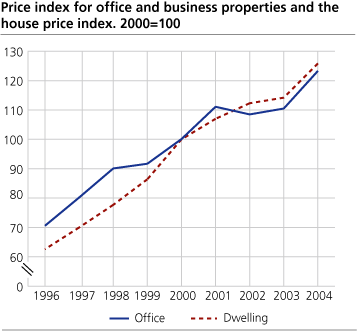
Prices of office and business properties increased by 6.8 per cent from the second half of 2003 to the second half of 2004, according to the price index from Statistics Norway.
From the first to the second half of 2004, however, prices of office and business properties decreased by 2.1 per cent.
Since 1996, prices of office and business properties have increased by about 75 per cent, while house prices rose by almost 101 per cent during the same period.
A total of 441 property transfers have been used in the calculation of the index for the second half of 2004.
Because of changes in the calculation model, the figures were revised in the first half of 2004. Office and business properties with prices per square meter lower than NOK 1 000, are no longer included in the calculations.
|
Data sources
The data for the price index are obtained from two sources: the Ground Property, Address and Building Register (GAB) and a quarterly survey. The GAB register provides information on price and location of the properties as well as purchaser information. The sales may cover parts of buildings as well as one or multiple buildings. Transfers of properties in connection with ownership changes in limited companies are not included.
Analysis
Sub-indices for the three price zones "municipalities of Oslo and Bærum", "municipalities of Stavanger, Bergen and Trondheim" and "rest of the country" are calculated using the hedonic method. These sub-indices are weighted and combined into the published index for the country as a whole. The weights represent the estimated total value of the stock of office and business properties within each price zone.
Other statistics
In addition to the price index for office and business properties, Statistics Norway produces statistics for all registered transfers of real property. The properties are divided into dwelling properties, holiday properties, agricultural/forestry/fishery properties, commercial/office properties, industrial properties, properties for communication purposes and other. In these statistics the average price per sale is calculated. |
Tables:
Contact
-
Statistics Norway's Information Centre
E-mail: informasjon@ssb.no
tel.: (+47) 21 09 46 42

