Content
Published:
This is an archived release.
Price increases in energy products and food
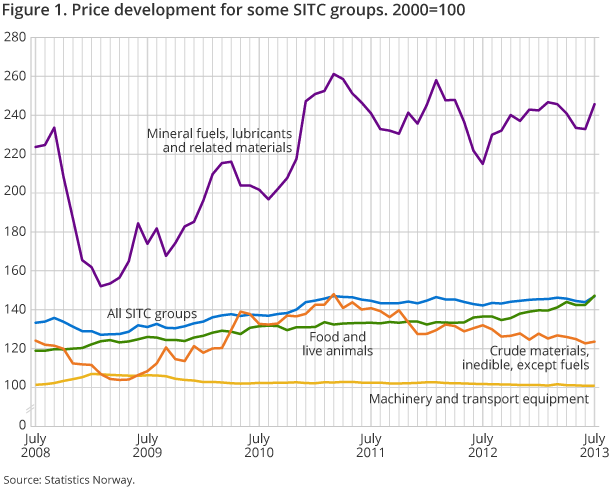
The price index of first-hand domestic sales (PIF) increased by 2.1 per cent from June to July 2013. The increase was due to higher prices of energy, food and chemicals. Compared with July 2012, the PIF was 3.3 per cent higher in July this year.
| Per cent | Per cent | Index | Weights1 | |
|---|---|---|---|---|
| July 2013 / June 2013 | July 2013 / July 2012 | July 2013 | ||
| 1The weights are updated annually, and are valid for the entire year. | ||||
| Product groups | ||||
| Total index | 2.1 | 3.3 | 146.9 | 1 000.0 |
| Food | 3.3 | 7.8 | 147.2 | 177.1 |
| Beverages and tobacco | 0.9 | 3.0 | 147.9 | 14.3 |
| Crude materials, inedible, except fuels | 0.7 | -6.3 | 123.6 | 52.5 |
| Mineral fuels, lubricants and related materials | 5.5 | 14.3 | 245.7 | 231.0 |
| Chemicals and related products, n.e.s. | 2.9 | 4.1 | 145.1 | 71.2 |
| Manufactured goods classified by material | 0.1 | -2.3 | 128.4 | 131.3 |
| Machinery and transport equipment | 0.0 | -0.9 | 100.9 | 231.9 |
| Miscellaneous manufactured articles | 0.4 | 0.1 | 112.0 | 84.6 |
The price index of first-hand domestic sales (PIF) for July was 146.9 (2000=100), compared to 143.9 in June, which corresponds to an increase of 2.1 per cent. Not since December 2010 has the rise in the index been so powerful, and we need to go back to March 2011 to find a similar high index level. All groups experienced price growth from June to July, but energy products, food and chemical products had the biggest impact on the overall index.
Monthly change: price rises of crude oil and fish
A significant price increase in petroleum and petroleum products of 6 per cent was the main reason why the total PIF went up from June to July. Prices of crude oil, Brent Blend measured in Norwegian kroner, rose by 7.5 per cent, and the price increase was spread over petroleum products, such as heating oil, diesel and gasoline. Prices of gas, natural and manufactured, went up 10.5 per cent due to higher prices for propane. In addition, electricity prices were 0.9 per cent higher in July compared with June. This reflected the price rise of 3 per cent in electricity traded on the Nordic power market Nord Pool.
Prices in food rose by 3.3 per cent. The price growth stemmed from higher prices of Norwegian fish, dairy and meat products. Fish prices increased by over 15 per cent due to a price rise for trout, salmon and cod. Dairy products became more expensive as a result of price increases for milk, butter and various types of cheeses. The price increase in the group meat and meat preparations was 1.8 per cent. The growth in this group was driven by miscellaneous meat preparations, while we did not observe any price increases in fresh meat in July. The index for fruits and vegetables, however, went down from June. Much of the price decline came from cheaper Norwegian vegetables, such as potatoes, cucumbers and lettuce, in July compared with June. The index for imported vegetables and fruits, however, increased in July.
Another commodity group that had a significant influence on the monthly change in the PIF was chemical products. The prices in this group increased by 2.9 per cent and sub-groups with the greatest price change were inorganic chemicals and fertilizers.
Twelve-month change: major increase in electricity and fish
From July 2012 to July 2013, the PIF increased by 3.3 per cent. The same groups that influenced the monthly change also affected the twelve-month change in the PIF. Mineral fuels, lubricants and related materials increased by more than 14 per cent due to higher prices for electricity, as well as crude oil and oil products. Electricity prices were as much as 58 per cent higher in July this year than in July last year. According to the Norwegian Water Resources and Energy Directorate, high reservoir levels and abnormally high inflows contributed to the low electricity prices last year. This year, both the inflow and water levels were considerably lower. Food prices increased by 7.8 per cent from July 2012 to July 2013, where fish, dairy products and feeding stuff for animals had the strongest price increase.
Prices of crude materials and manufactured goods declined from July last year to July this year. Prices in crude materials fell by over 6 per cent due to a fall in prices of metalliferous ores and metal scrap. In the case of manufactured goods, lower prices for goods of metals contributed the most to the decrease in the group.
Additional information
Contact
-
Producer price index
E-mail: produsentpris@ssb.no
tel.: (+47) 21 09 40 00
-
Elisabeth Mælum
E-mail: elisabeth.maelum@ssb.no
tel.: (+47) 97 01 28 49
-
Monika Græsli Engebretsen
E-mail: monika.graesli.engebretsen@ssb.no
tel.: (+47) 40 90 23 71
-
Morten Madshus
E-mail: morten.madshus@ssb.no
tel.: (+47) 40 90 26 94

