Content
Published:
This is an archived release.
Falling crude materials prices
The price index of first-hand domestic sales (PIF) fell by 0.4 per cent from May to June 2013, mainly due to lower prices of electricity, crude materials and chemical products. Compared with the same month in 2012, the PIF was 0.7 per cent higher in June this year.
| Per cent | Per cent | Index | Weights1 | |
|---|---|---|---|---|
| June 2013 / May 2013 | June 2013 / June 2012 | June 2013 | ||
| 1The weights are updated annually, and are valid for the entire year. | ||||
| Product groups | ||||
| Total index | -0.4 | 0.7 | 143.9 | 1 000.0 |
| Food | 0.1 | 4.9 | 142.5 | 177.1 |
| Beverages and tobacco | -4.2 | 2.3 | 146.6 | 14.3 |
| Crude materials, inedible, except fuels | -1.8 | -5.9 | 122.7 | 52.5 |
| Mineral fuels, lubricants and related materials | -0.3 | 5.0 | 232.9 | 231.0 |
| Chemicals and related products, n.e.s. | -1.3 | -0.1 | 141.0 | 71.2 |
| Manufactured goods classified by material | -0.1 | -2.5 | 128.3 | 131.3 |
| Machinery and transport equipment | -0.2 | -1.0 | 100.9 | 231.9 |
| Miscellaneous manufactured articles | 0.1 | -0.2 | 111.6 | 84.6 |
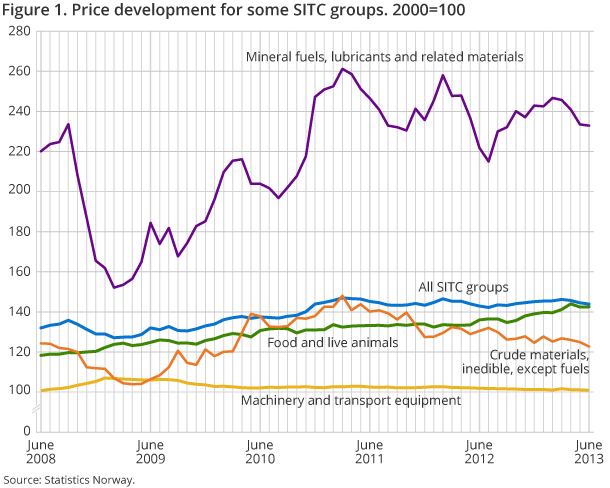
The price index of first-hand domestic sales (PIF) has fluctuated around a level slightly below 145 (with 2000=100) since early 2011. The index has fallen for the past three months, and was at 143.9 for June. Prices of inedible crude materials, except fuels, have been falling since the first half of 2011. The decline has been steepest for metalliferous ores and metal scrap, but we have also seen lower prices for crude materials such as paper pulp, wood and lumber. Other product groups where prices have fallen over the past years, although not as much, are manufactured goods, machinery and transport equipment. At the same time, prices have increased for food, beverages and chemical products. Together with fluctuating prices for mineral fuels and electricity, these trends have led to a relatively stable all-item PIF.
Monthly rate: broad price decline
The all-item PIF fell by 0.4 per cent from May to June. Electricity prices usually fall in the summer, and this year the decline was 4.9 per cent in the first summer month. Indices for most other product groups also showed falling prices. For crude materials, prices were 1.8 per cent lower, while prices of chemical products fell by 1.3 per cent.
The index for vegetables and fruit increased by 8.3 per cent from May to June. The strong growth was mainly due to the arrival of the summer’s first newly harvested potatoes, which are usually more expensive than other potatoes. Prices of fish, meat and dairy products, on the other hand, decreased somewhat from May to June. The index for all food products showed a small price increase of 0.1 per cent.
The PIF measures price changes both for imported goods and domestically produced goods sold to Norwegian customers; the so-called domestic market. The index for the domestic market only fell by 0.6 per cent from May to June, which is a stronger decline than for the total index. The reason for this is that products with the biggest price falls, such as electricity and fish, are more important when imported goods are excluded.
Twelve-month rate: PIF up 0.7 per cent
Compared with June 2012, the PIF was 0.7 per cent higher in June this year. Prices of food and electricity were the main drivers behind the overall increase. Despite the decrease in the last month, prices of electricity were almost 20 per cent higher in June than in the same month last year.
As noted above, prices in some product groups have had a declining tendency over the past few years. Prices of crude materials were almost 6 per cent lower in June than twelve months earlier. The index for manufactured goods classified by material fell by 2.5 per cent over the same period.
Additional information
Contact
-
Producer price index
E-mail: produsentpris@ssb.no
tel.: (+47) 21 09 40 00
-
Elisabeth Mælum
E-mail: elisabeth.maelum@ssb.no
tel.: (+47) 97 01 28 49
-
Monika Græsli Engebretsen
E-mail: monika.graesli.engebretsen@ssb.no
tel.: (+47) 40 90 23 71
-
Morten Madshus
E-mail: morten.madshus@ssb.no
tel.: (+47) 40 90 26 94

