Content
Published:
This is an archived release.
Price increases in electricity and food
The price index of first-hand domestic sales (PIF) rose by 1.1 per cent from November to December due to higher electricity and food prices, as well as a price rise in crude materials.
The rise in the price index for the first-hand domestic sales from November to December due to large price rises in electricity and food, as well as price increases for several types of goods within the group of crude materials, inedible, except fuels.
High power consumption due to cold weather, low inflow to water reservoirs and low power production in the Nordic countries contributed to price increases in electricity by 8.9 per cent from November to December. Similarly, the low winter temperatures in Europe and the UK contributed to a price rise in gas last month.
Prices within the group of crude materials, inedible, except fuels went up by 6.8 per cent in December. The largest contribution to price rises in this group comes from metalliferous ores and metal scrap, which rose 15 per cent from November to December. This reflects the rise in metal prices in world markets from the second quarter of 2009. Price rises for manufactured goods such as non-ferrous metals and iron and steel last month of 5.8 and 0.1 respectively can be explained by the same reasons.
Additionally, the price index for food rose by 1.5 per cent from November to December. Fish and vegetables and fruit, as well as meat and meat preparations in particular were the reason for the rise in food prices.
Higher twelve-month change
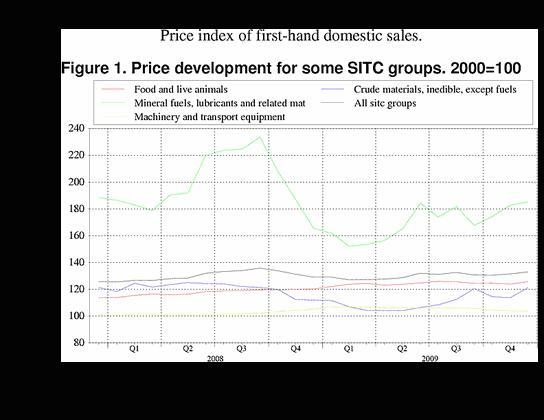
The price index of first-hand domestic sales increased by 3.1 per cent from December 2008 to December 2009. Prices of mineral fuels, lubricants and related materials rose by 11.9 per cent, while food prices rose by 4.5 per cent. The petroleum and petroleum products, as well as electricity, accounted for the rise in the twelve-month rate within the former group. Prices for all food products increased in December 2009 compared to December 2008. The group of crude materials went up by 8.4 per cent, and it is particularly metalliferous ores and metal scrap that contributed most to the increase in the twelve-month rate.
2009 vs. 2008: small decrease in prices
The price index for the first-hand domestic sales fell by 0.2 per cent from 2008 to 2009. The main reason for this is weak growth in prices in 2009, and outstanding development in the overall index in 2008 due to the global financial crisis. In 2008, prices increased sharply until September, and then fell considerably at the end of 2008 until early 2009.
Food products had annual growth of 5.6 per cent from 2008 to 2009. It is mainly meat and meat preparations, fish and fish products, cereals and cereal preparations, as well as sugars, sugar preparations and honey that have been responsible for annual price growth in this group.
Prices of machinery and transport equipment grew by 3.7 per cent on an annual basis. Despite a slight decline in prices through 2009, the average was at a higher level in 2009 than in the previous year.
Price developments in mineral fuels, lubricants and related materials, as well as crude materials, have contributed to lower annual growth in the overall index in 2009. The fall in mineral fuels, lubricants and related materials was 14.8 per cent from 2008 to 2009. In 2008, prices for both oil and electricity were record high and fell sharply at the end of the year. A decline in metalliferous ores and metal scrap, as well as pulp and waste paper, and wood, lumber and cork in 2009 caused a decline in annual growth for crude materials by 8.4 per cent from 2008 to 2009.
| December 2009 | Changes, per cent | ||||||||||||||||||||||||||||||||||||||||||||||||||||||||||||||||||||||||||||||
|---|---|---|---|---|---|---|---|---|---|---|---|---|---|---|---|---|---|---|---|---|---|---|---|---|---|---|---|---|---|---|---|---|---|---|---|---|---|---|---|---|---|---|---|---|---|---|---|---|---|---|---|---|---|---|---|---|---|---|---|---|---|---|---|---|---|---|---|---|---|---|---|---|---|---|---|---|---|---|---|
|
November 2009-
December 2009 |
December 2008-
December 2009 |
||||||||||||||||||||||||||||||||||||||||||||||||||||||||||||||||||||||||||||||
| Total index | 133.0 | 1.1 | 3.1 | ||||||||||||||||||||||||||||||||||||||||||||||||||||||||||||||||||||||||||||
| Food and live animals | 125.7 | 1.5 | 4.5 | ||||||||||||||||||||||||||||||||||||||||||||||||||||||||||||||||||||||||||||
| Beverages and tobacco | 136.6 | -0.1 | 6.9 | ||||||||||||||||||||||||||||||||||||||||||||||||||||||||||||||||||||||||||||
| Crude materials, inedible, except fuels | 121.3 | 6.8 | 8.4 | ||||||||||||||||||||||||||||||||||||||||||||||||||||||||||||||||||||||||||||
| Mineral fuels, lubricants and related materials | 185.2 | 1.3 | 11.9 | ||||||||||||||||||||||||||||||||||||||||||||||||||||||||||||||||||||||||||||
| Chemicals and related products, n.e.s | 127.2 | 0.5 | -2.7 | ||||||||||||||||||||||||||||||||||||||||||||||||||||||||||||||||||||||||||||
| Manufactured goods classified by material | 124.4 | 0.7 | 0.6 | ||||||||||||||||||||||||||||||||||||||||||||||||||||||||||||||||||||||||||||
| Machinery and transport equipment | 103.6 | -0.3 | -1.6 | ||||||||||||||||||||||||||||||||||||||||||||||||||||||||||||||||||||||||||||
| Miscellaneous manufactured articles | 108.6 | 0.3 | -0.2 | ||||||||||||||||||||||||||||||||||||||||||||||||||||||||||||||||||||||||||||
Additional information
Contact
-
Producer price index
E-mail: produsentpris@ssb.no
tel.: (+47) 21 09 40 00
-
Elisabeth Mælum
E-mail: elisabeth.maelum@ssb.no
tel.: (+47) 97 01 28 49
-
Monika Græsli Engebretsen
E-mail: monika.graesli.engebretsen@ssb.no
tel.: (+47) 40 90 23 71
-
Morten Madshus
E-mail: morten.madshus@ssb.no
tel.: (+47) 40 90 26 94

