Content
Published:
This is an archived release.
Lower prices of oil and electricity
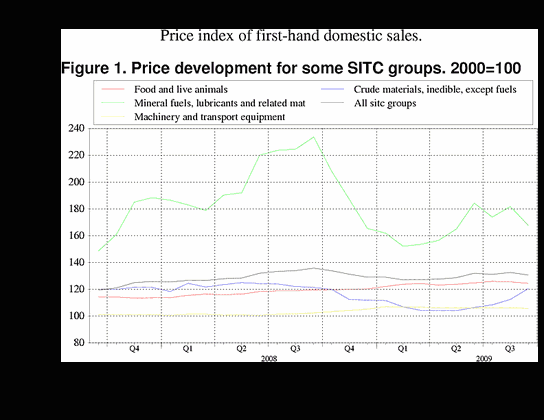
The price index of first-hand domestic sales fell by 1.5 per cent from August to September. Reduced prices of electricity, petroleum and petroleum products contributed the most to the overall decrease.
While the price index of first hand domestic sales increased in the previous month, the index decreased by 1.5 per cent from August to September. Prices of petroleum and petroleum products, which have fluctuated in recent months, were the most important contributions to both the increase in the previous month and the decrease this month. Although the prices fell by 7.3 per cent from August to September, the price index for petroleum and petroleum products is approximately the same as in July.
A12.1 per cent lower electricity price also made an important contribution to the overall decrease in product prices. The spot price of electricity has decreased continually since June.
Food prices declined one per cent from August to September. The main contributions to this decline were lower prices of fish and vegetables and fruit, with 3.2 and 5.8 lower prices respectively. Both of these product groups experienced a decline in prices last month as well, but this month’s decline is stronger.
Twelve month change: prices down 3.8 per cent
The price index of first-hand domestic sales fell 3.8 per cent from September 2008 to September 2009. This was also mainly due to lower prices of petroleum and petroleum products together with electricity. Within these product groups, prices fell 21.6 and 55 per cent respectively.
| September 2009 | Changes, per cent | ||||||||||||||||||||||||||||||||||||||
|---|---|---|---|---|---|---|---|---|---|---|---|---|---|---|---|---|---|---|---|---|---|---|---|---|---|---|---|---|---|---|---|---|---|---|---|---|---|---|---|
| August 2009-September 2009 | September 2008-September 2009 | ||||||||||||||||||||||||||||||||||||||
| Total index | 130.7 | -1.5 | -3.8 | ||||||||||||||||||||||||||||||||||||
| Food and live animals | 124.4 | -1.0 | 3.9 | ||||||||||||||||||||||||||||||||||||
| Beverages and tobacco | 135.7 | -0.1 | 8.1 | ||||||||||||||||||||||||||||||||||||
| Crude materials, inedible, except fuels | 120.6 | 7.3 | -0.7 | ||||||||||||||||||||||||||||||||||||
| Mineral fuels, lubricants and related materials | 167.6 | -7.8 | -28.3 | ||||||||||||||||||||||||||||||||||||
| Chemicals and related products, n.e.s | 127.1 | -0.9 | -3.3 | ||||||||||||||||||||||||||||||||||||
| Manufactured goods classified by material | 124.2 | -0.2 | -1.6 | ||||||||||||||||||||||||||||||||||||
| Machinery and transport equipment | 105.8 | -0.4 | 3.4 | ||||||||||||||||||||||||||||||||||||
| Miscellaneous manufactured articles | 109.1 | -0.3 | 3.9 | ||||||||||||||||||||||||||||||||||||
Additional information
Contact
-
Producer price index
E-mail: produsentpris@ssb.no
tel.: (+47) 21 09 40 00
-
Elisabeth Mælum
E-mail: elisabeth.maelum@ssb.no
tel.: (+47) 97 01 28 49
-
Monika Græsli Engebretsen
E-mail: monika.graesli.engebretsen@ssb.no
tel.: (+47) 40 90 23 71
-
Morten Madshus
E-mail: morten.madshus@ssb.no
tel.: (+47) 40 90 26 94

