Content
Published:
This is an archived release.
Mild growth for storage services
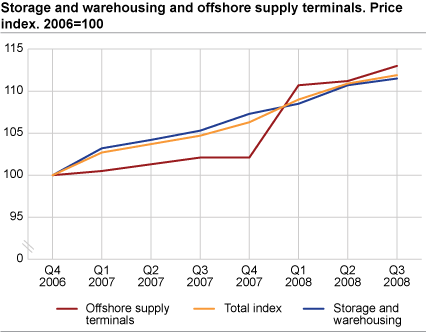
Prices for storage services grew on average by 0.9 per cent from the second quarter of 2008 to the third quarter of 2008. The annual price change from the third quarter of 2007 to the third quarter of 2008 was about 7.2 per cent.
The purpose of the index is to show an aggregate price development over time for the storage and warehousing, and offshore supply terminals.
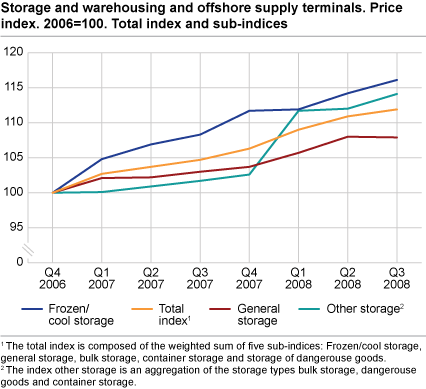
The total index had an average price growth of merely 0.9 per cent from second quarter to the third quarter of this year. The corresponding growth for frozen/cool storage is about 1.7 per cent, while a decline in about 0.1 percent was registered for general storage.
|
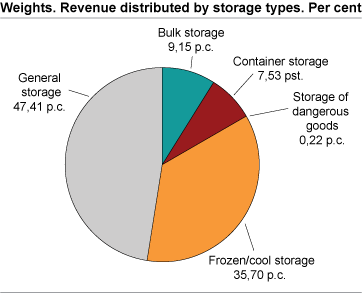
The total index is the weighted average of five sub-indices pertaining to differen storage types. The sub-indices show the price development in the two main storage types, namely frozen/cool storage and general storage. The two sub-indices constitute about 83 per cent of the total weight in the sample. In addition, a third sub-index that combines the three smaller storage types is published. This sub-index covers bulk storage, container storage, and storage of dangerous goods.
The businesses used in the index belong to two business categories. The majority of the businesses are taken from storage and warehousing (NACE 63.120), which represents about 90 per cent of the total weight while the remaining 10 per cent come from offshore supply terminals (NACE 63.224). A sub-index for both business categories is also published. |
Tables:
The statistics is published with Producer price indices for services.
Contact
-
Statistics Norway's Information Centre
E-mail: informasjon@ssb.no
tel.: (+47) 21 09 46 42


