Content
Published:
This is an archived release.
From the January index, which will be published on 10 February 2017, the CPI base year will change to 2015 (2015=100). This also applies to CPI-AT, CPI-ATE and other series.
In Statbank Norway the current time series will be moved to archive tables under Closed series. Between 24 January and 10 February 2017 the current Statbank tables will contain no figures. See also Changes to tables in Statbank.
More information about the new base year will be published 10 February 2017
Food prices pulled the CPI down in December
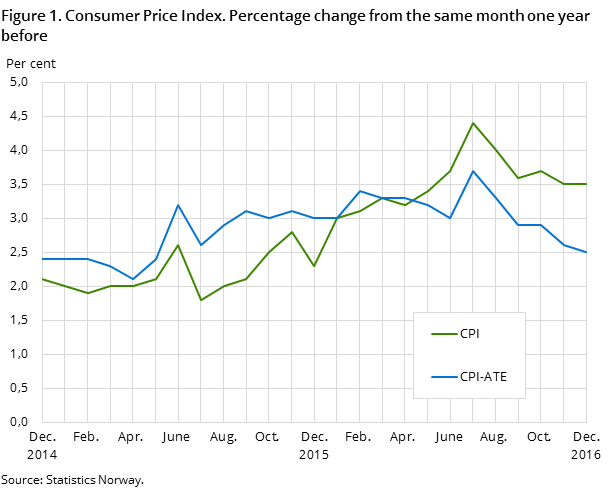
The Consumer Price Index (CPI) fell 0.5 per cent from November to December 2016. The year-to-year growth in the CPI was 3.5 per cent in December, unchanged from November.
| Monthly change (per cent) | 12-month rate (per cent) | Index | |
|---|---|---|---|
| November 2016 - December 2016 | December 2015 - December 2016 | December 2016 | |
| CPI All-item index | -0.5 | 3.5 | 146.0 |
| Food and non-alcoholic beverages | -2.8 | 1.7 | 133.1 |
| Housing, water, electricity, gas and other fuels | -0.9 | 5.6 | 181.4 |
| Transport | 0.1 | 2.7 | 154.7 |
| Recreation and culture | 0.4 | 3.9 | 131.5 |
| Clothing and footwear | -0.8 | 3.4 | 58.6 |
| CPI-ATE (July 1999 = 100) | -0.4 | 2.5 | 135.8 |
| CPI by delivery sector | |||
| (December 2014 = 100) | |||
| Consumer goods | -0.9 | 4.0 | 106.6 |
| Services | -0.1 | 2.8 | 105.2 |
| Services where labor dominates | 0.1 | 3.1 | 106.3 |

The year-to-year CPI-ATE growth was 2.5 per cent in December, down 0.1 percentage points from November. The CPI was 146.0 (1998=100) in December 2016, compared to 141.1 in December 2015, which corresponds to a year-to-year growth of 3.5 per cent. Annual growth in the CPI was 3.6 per cent for 2016, while it was 3.0 per cent for the annual CPI-ATE.
Monthly change: Christmas discounts pulled food prices down
From November to December, the CPI fell 0.5 per cent, partly due to a continued fall in the prices of food. For the fifth consecutive month the prices of food fell; from November to December the prices decreased 3.1 per cent. It was mainly discounts in connection with Christmas that caused the fall, where particularly products such as chocolate, meats, Norwegian agricultural products and fruit showed large price decreases.
Electricity prices including grid rent fell 5.3 per cent from November to December, due to milder temperatures and higher production in December, combined with a scarcer resource situation in November. The prices of clothes fell 1.1 per cent in the period, while airfares fell 4.3 per cent.
The decline in the CPI was mainly dampened by the price development of fuels and lubricants. Petrol prices were 1.5 per cent higher in December than in November, while prices of diesel were 2.3 per cent higher. Also prices of furniture and furnishings dampened the CPI with a 1.8 per cent price increase in the period.
Year-to-year growth: Still increasing electricity prices
From December 2015 to December 2016, the CPI grew 3.5 per cent. Higher electricity prices were the main contributor to the year-to-year growth; prices on electricity including grid rent showed a year-to-year increase of 28.9 per cent in December. The CPI excluding electricity (CPI-AEL) increased by 2.8 per cent from December 2015 to December 2016, hence electricity prices pulled the year-to-year growth in the CPI up by 0.7 percentage points.
A 2.0 per cent fall in the prices of imported agricultural products was the main dampening component for the year-to-year growth. Particularly the prices of fruit contributed with a price decrease of 6.1 per cent from December 2015 to December 2016.
Change in the year-to-year growth: Unchanged growth rate
The year-to-year growth in the CPI was 3.5 per cent in December, unchanged from November.
The year-to-year growth in the CPI-ATE was 2.5 per cent in December, down 0.1 percentage points from November. One reason being the development of airfares which increased 4.6 per cent from November to December 2015, while fell 4.3 per cent the same period in 2016.
New detailed consumer classification, ECOICOPOpen and readClose
The CPI adopted Eurostat’s new detailed 5-digit consumer classification, ECOICOP in January 2016. Statistics Norway has published unofficial 5 and 6-digit COICOP indices for the consumer group Food and non-alcoholic beverages up until January 2016. As a result of a discrepancy between the unofficial and the new official ECOICOP, some previously published indices are no longer available. This results in new names for some of the published groups.
Contact
-
Statistics Norway's Information Centre
E-mail: informasjon@ssb.no
tel.: (+47) 21 09 46 42
-
Konsumprisindeksen
E-mail: konsumprisindeksen@ssb.no
tel.: (+47) 62 88 56 34
-
Camilla Rochlenge
E-mail: camilla.rochlenge@ssb.no
tel.: (+47) 40 90 23 72
-
Kjersti Nyborg Hov
E-mail: kjersti.nyborg.hov@ssb.no
tel.: (+47) 40 90 23 63
-
Gunnar Larsson
E-mail: gunnar.larsson@ssb.no
tel.: (+47) 40 90 26 79
-
Trym Kristian Økland
E-mail: trym.okland@ssb.no
tel.: (+47) 46 81 09 15
