Content
Published:
This is an archived release.
Small changes in the CPI
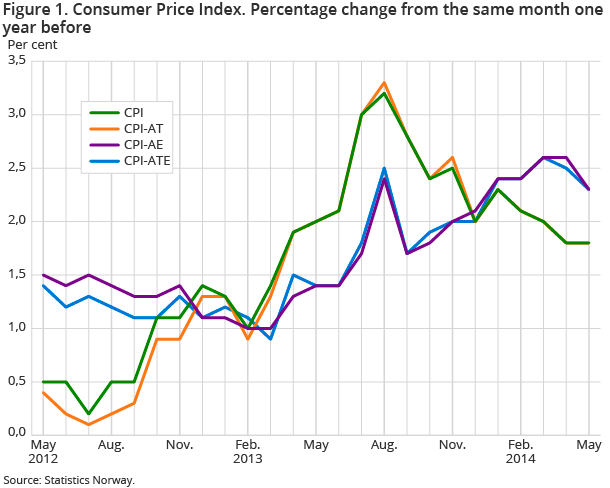
The Consumer Price Index (CPI) rose by 0.1 per cent from April to May, mainly due to higher prices of food and beverages. The year-to-year growth in the CPI was 1.8 per cent in May, while the CPI-ATE growth was 2.3 per cent in the same period.
| Monthly change (per cent) | 12-month rate (per cent) | Index | |
|---|---|---|---|
| April 2014 - May 2014 | May 2013 - May 2014 | May 2014 | |
| CPI All-item index | 0.1 | 1.8 | 136.7 |
| Food and non-alcoholic beverages | 1.2 | 3.4 | 129.0 |
| Housing, water, electricity, gas and other fuels | -0.2 | 0.3 | 165.9 |
| Transport | -0.2 | 2.0 | 149.4 |
| Recreation and culture | -0.8 | 2.1 | 119.2 |
| Clothing and footwear | -0.2 | -1.3 | 54.8 |
| CPI-ATE (july 1999 = 100) | 0.2 | 2.3 | 127.8 |
| CPI by delivery sector | |||
| Other consumer goods produced in Norway | 0.3 | -0.6 | 159.9 |
| Imported consumer goods | 0.1 | 1.2 | 91.6 |
| Other services with wages as dominating price factor | 0.1 | 3.7 | 208.3 |

The CPI was 136.7 (1998=100) in May 2014, compared to 134.3 in May 2013, which corresponds to a year-to-year growth of 1.8 per cent.
Monthly change: higher prices of food, beverages and fuels
The CPI increased 0.1 per cent from April to May. Higher prices of food and non-alcoholic beverages contributed most to the rise. Food prices rose 0.9 per cent and prices of beverages increased 2.8 per cent, recovering after last month’s drop. Several groups of food had price increases, the most important being chocolate, citrus fruit, frozen pizza and mutton/lamb. These rises must be seen in conjunction with the Easter sales campaign lowering prices last month. Within the beverages group, the most important price increases were for coffee, soft drinks and juice.
Prices of fuels and lubricants went up by 2.0 per cent from April to May. In the same period, higher prices of products for personal care and furniture, and increased rents contributed in pulling the CPI up.
From April to May, airfares decreased by 9.3 per cent, thus pulling the CPI down. These lower prices must also be seen in conjunction with the relatively high price increase that was measured in the Easter period last month. Prices of newspapers, books and stationery had a price decrease of 5.0 per cent, while prices of electricity including grid rent fell 2.9 per cent.
Year-to-year growth: higher prices of food and increased rents
The CPI rose by 1.8 per cent from May 2013 to May 2014. Over the last twelve months, prices of food and non-alcoholic beverages showed a combined price increase of 3.4 per cent. Imputed rentals for owner-occupiers rose 3.1 per cent, and actual rentals paid by tenants increased by 3.3 per cent. In the same period, prices of maintenance and repair of personal transportation rose 3.8 per cent, while prices of the group furniture, furnishings and decorations increased 11.2 per cent. Alcoholic beverages and tobacco had a combined year-to-year growth of 3.7 per cent, and financial services n.e.c. rose 4.0 per cent.
The year-to-year growth in the CPI was mainly dampened by lower prices of electricity including grid rent, which fell by 13.2 per cent. The CPI excluding electricity (CPI-AEL) rose 2.4 per cent in the last twelve months, hence electricity prices contributed to a 0.6 percentage point decrease in the year-to-year growth in the CPI.
In the last twelve months, airfares went down 14.5 per cent, and together with lower prices of clothing and telephone services contributed in keeping down the growth in the CPI.
Change in the year-to-year growth: weaker growth rate in the underlying prices
The year-to-year growth in the CPI was unchanged from April to May at 1.8 per cent.
The year-to year growth in the CPI-ATE was 2.3 per cent in May, down 0.2 percentage points from April. The main contributor to the decline was the price development of airfares. Prices fell more than 9 per cent from April to May 2014, while increasing more than 18 per cent in the same period in 2013. The price development for the group newspapers, books and stationery also contributed, with a much greater decrease from April to May this year than in the same period last year.
Contact
-
Statistics Norway's Information Centre
E-mail: informasjon@ssb.no
tel.: (+47) 21 09 46 42
-
Konsumprisindeksen
E-mail: konsumprisindeksen@ssb.no
tel.: (+47) 62 88 56 34
-
Camilla Rochlenge
E-mail: camilla.rochlenge@ssb.no
tel.: (+47) 40 90 23 72
-
Kjersti Nyborg Hov
E-mail: kjersti.nyborg.hov@ssb.no
tel.: (+47) 40 90 23 63
-
Gunnar Larsson
E-mail: gunnar.larsson@ssb.no
tel.: (+47) 40 90 26 79
-
Trym Kristian Økland
E-mail: trym.okland@ssb.no
tel.: (+47) 46 81 09 15
