Content
Published:
This is an archived release.
CPI up 0.5 per cent
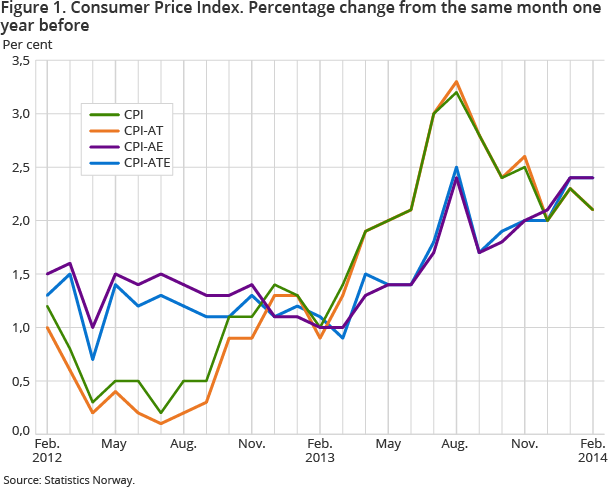
The Consumer Price Index (CPI) rose by 0.5 per cent from January to February, mainly due to higher airline fares and food prices. The year-to-year growth in the CPI was 2.1 per cent in February, while the CPI-ATE was 2.4 per cent in the same period.
| Monthly change (per cent) | 12-month rate (per cent) | Index | |
|---|---|---|---|
| January 2014 - February 2014 | February 2013 - February 2014 | February 2014 | |
| CPI All-item index | 0.5 | 2.1 | 135.8 |
| Food and non-alcoholic beverages | 1.3 | 3.7 | 127.6 |
| Housing, water, electricity, gas and other fuels | -0.2 | 2.0 | 167.9 |
| Transport | 1.3 | 1.4 | 147.8 |
| Recreation and culture | -0.5 | 1.7 | 117.4 |
| Clothing and footwear | 0.2 | 0.4 | 52.6 |
| CPI-ATE (july 1999 = 100) | 0.6 | 2.4 | 126.3 |
| CPI by delivery sector | |||
| Other consumer goods produced in Norway | -0.4 | 1.6 | 162.6 |
| Imported consumer goods | 0.4 | 1.2 | 90.3 |
| Other services with wages as dominating price factor | 0.4 | 3.2 | 207.1 |

The CPI was 135.8 (1998=100) in February 2014, compared to 133.0 in February 2013, which corresponds to a year-to-year growth of 2.1 per cent.
Monthly change: higher airfares and food prices
The CPI increased 0.5 per cent from January to February. Airfares contributed most to the rise with an increase of 23.9 per cent. The price increase can be seen in the context of a seasonal rise in prices of flights together with the particularly low price level measured in January. Food prices rose by 1.5 per cent from January to February, and the rise was present in most food groups. The increase, which appeared as normal in February, must be seen in accordance with a price adjustment for some of the food groups; especially fish, dairy products, together with oils and fats.
The price of furniture, carpets and reparations also contributed to the rise in the CPI. The consumer group increased 4.6 per cent from January to February. The higher prices were mainly due to increased prices following sales activity in January.
This month’s increase in the CPI was dampened by a price fall in electricity including grid rent of 2.8 per cent. The annual Mammut sale led to a fall in book prices of 13.1 per cent from January to February.
Year-to-year growth: increased food prices and cost of living
The CPI rose by 2.1 per cent from February 2013 to February 2014. Over the last twelve months, food prices have increased by 3.8 per cent. Every food group showed a positive year-to-year growth. The groups fish and meat made a particular contribution; salmon/trout was the main reason for higher food prices, with an increase of 15.2 per cent. The price growth can be explained by a higher demand on the world market in combination with an unchanged supply of salmon.
Imputed rentals for owner-occupiers rose by 3.4 per cent from February 2013 to February 2014. In the same period the price of maintenance and repair of personal transport equipment increased by 2.7 per cent. Over the last twelve months, the price of furniture and furnishings rose by 6.3 per cent due to higher prices of furniture. Prices on restaurant services rose 3.0 per cent from February 2013 to February 2014.
The year-to-year growth in the CPI was mainly curbed by lower prices of electricity and airfares. Electricity including grid rent prices showed a decline of 3.8 per cent from February 2013 to February 2014. Airfares were measured with a price fall of 11.8 per cent in the same period.
Change in the year-to-year growth: lower growth rate in the CPI
The year-to-year growth in the CPI fell from 2.3 per cent in January 2013 to 2.1 per cent in February 2014. The main contributor to the decline was the price development of furniture. Prices of furniture and furnishings increased 4.9 per cent from January to February 2014, while increasing 11.0 per cent the same period the year before. The price development of electricity prices, together with the price development of fuels and lubricants for personal transport equipment also had a negative impact on the fall in the year-to-year growth. On the other hand, the price development of food pulled the growth in the CPI in the opposite direction.
The year-to year growth in the CPI-ATE was 2.4 per cent in February, unchanged from January.
Contact
-
Statistics Norway's Information Centre
E-mail: informasjon@ssb.no
tel.: (+47) 21 09 46 42
-
Konsumprisindeksen
E-mail: konsumprisindeksen@ssb.no
tel.: (+47) 62 88 56 34
-
Camilla Rochlenge
E-mail: camilla.rochlenge@ssb.no
tel.: (+47) 40 90 23 72
-
Kjersti Nyborg Hov
E-mail: kjersti.nyborg.hov@ssb.no
tel.: (+47) 40 90 23 63
-
Gunnar Larsson
E-mail: gunnar.larsson@ssb.no
tel.: (+47) 40 90 26 79
-
Trym Kristian Økland
E-mail: trym.okland@ssb.no
tel.: (+47) 46 81 09 15
