Content
Published:
This is an archived release.
Growth in airline fares
The CPI increased by 0.5 per cent from March to April 2011, mainly due to higher prices on airline fares. The CPI rose by 1.3 per cent from April 2010 to April 2011, while CPI-ATE increased by 1.3 per cent in the same period.
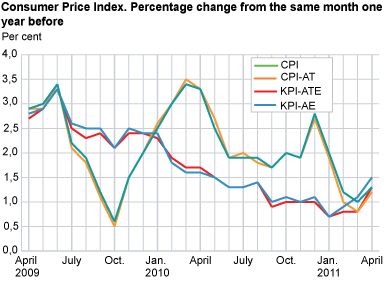
The Consumer price index (CPI) was 131.3 (1998=100) as per April 2011, compared with 129.6 in the corresponding period in 2010. This was equivalent to a year-to-year growth of 1.3 per cent in April 2011, up 0.3 percentage points from the previous month. The year-to year growth in the CPI-ATE was 1.3 per cent in April 2011.
Increased airline fares in April
The CPI rose 0.5 per cent from March to April 2011. It was mainly the prices on airline fares that contributed, with an increase of 54.2 per cent. This was related to a strong growth in foreign destinations. The price increase must be seen together with more frequent travels due to Easter.
The prices on books rose by 19.2 per cent, after a sales period in February and March. The prices on fuel and lubricants rose by 1.8 per cent from March to April 2011, while the prices on clothing and footwear rose by 0.9 per cent.
The electricity including grid rent dampened the increase in the CPI, with a price falls of 5.8 per cent.
The CPI increased by 1.3 per cent the last twelve months
The CPI rose by 1.3 per cent from April 2010 to April 2011. The airline fares together with the prices on fuel and lubricants contributed mostly with increases corresponding to 48.6 and 10.0 respectively. Imputed rentals for owner-occupiers rose by 2.1 per cent in the same period.
The prices on electricity including grid rent together with prices on food fell by 8.9 and 2.4 per cent respectively. Audiovisual equipment and clothing also decreased in the last twelve months.
Increase in the year-to-year growth
The year-to-year growth in the CPI rose by 0.3 percentage points, from 1.0 per cent in March to 1.3 per cent in April. This is due to a strong increase in airline fares from March 2011 to April 2011 compared to a fall in the corresponding period last year.
In the opposite direction, the prices on foods, clothing and electricity contributed the most.
The year-to year growth in the CPI-ATE was 1.3 per cent in April 2011, up 0.5 percentage points from March 2011.
| Weights | Index | Change in per cent | |||||||||||||||||||||||||||||||||||||||||||||||||||||||||||||||||||||||||||||
|---|---|---|---|---|---|---|---|---|---|---|---|---|---|---|---|---|---|---|---|---|---|---|---|---|---|---|---|---|---|---|---|---|---|---|---|---|---|---|---|---|---|---|---|---|---|---|---|---|---|---|---|---|---|---|---|---|---|---|---|---|---|---|---|---|---|---|---|---|---|---|---|---|---|---|---|---|---|---|---|
| January 2011- December 2011 |
April 2011 | March 2011- April 2011 |
April 2010- April 2011 |
January-April 2010- January-April 2011 |
|||||||||||||||||||||||||||||||||||||||||||||||||||||||||||||||||||||||||||
| CPI All-item index | 1 000.0 | 131.3 | 0.5 | 1.3 | 1.4 | ||||||||||||||||||||||||||||||||||||||||||||||||||||||||||||||||||||||||||
| Food and non-alcoholic beverages | 133.1 | 121.7 | -0.2 | -1.1 | -0.7 | ||||||||||||||||||||||||||||||||||||||||||||||||||||||||||||||||||||||||||
| Alcoholic beverages and tobacco | 42.3 | 156.5 | 0.1 | 6.0 | 6.0 | ||||||||||||||||||||||||||||||||||||||||||||||||||||||||||||||||||||||||||
| Clothing and footwear | 56.8 | 57.8 | 0.9 | -2.9 | -4.0 | ||||||||||||||||||||||||||||||||||||||||||||||||||||||||||||||||||||||||||
| Housing, water, electricity, fuels | 214.9 | 161.6 | -0.9 | 0.4 | 2.3 | ||||||||||||||||||||||||||||||||||||||||||||||||||||||||||||||||||||||||||
| Furnishings household equipment | 60.2 | 107.1 | 0.9 | -0.4 | -0.9 | ||||||||||||||||||||||||||||||||||||||||||||||||||||||||||||||||||||||||||
| Health | 30.0 | 153.6 | - | 2.3 | 2.5 | ||||||||||||||||||||||||||||||||||||||||||||||||||||||||||||||||||||||||||
| Transport | 133.7 | 144.4 | 3.6 | 5.5 | 2.6 | ||||||||||||||||||||||||||||||||||||||||||||||||||||||||||||||||||||||||||
| Communications | 27.5 | 70.9 | - | -2.6 | -3.0 | ||||||||||||||||||||||||||||||||||||||||||||||||||||||||||||||||||||||||||
| Recreation and culture | 134.8 | 116.0 | 0.8 | 0.4 | 0.4 | ||||||||||||||||||||||||||||||||||||||||||||||||||||||||||||||||||||||||||
| Education | 2.7 | 166.8 | - | 2.3 | 2.3 | ||||||||||||||||||||||||||||||||||||||||||||||||||||||||||||||||||||||||||
| Restaurants and hotels | 50.3 | 153.6 | 0.1 | 2.3 | 2.7 | ||||||||||||||||||||||||||||||||||||||||||||||||||||||||||||||||||||||||||
| Miscellaneous goods and services | 113.8 | 140.3 | 0.5 | 2.9 | 2.7 | ||||||||||||||||||||||||||||||||||||||||||||||||||||||||||||||||||||||||||
| CPI-AE | .. | 125.0 | 0.8 | 1.5 | 1.1 | ||||||||||||||||||||||||||||||||||||||||||||||||||||||||||||||||||||||||||
| CPI-AT | .. | 128.0 | 0.5 | 1.2 | 1.2 | ||||||||||||||||||||||||||||||||||||||||||||||||||||||||||||||||||||||||||
| CPI-ATE | .. | 121.8 | 0.8 | 1.3 | 0.9 | ||||||||||||||||||||||||||||||||||||||||||||||||||||||||||||||||||||||||||
| CPI-ATE seasonal adjusted | .. | 121.3 | 0.4 | ||||||||||||||||||||||||||||||||||||||||||||||||||||||||||||||||||||||||||||
Tables
Contact
-
Statistics Norway's Information Centre
E-mail: informasjon@ssb.no
tel.: (+47) 21 09 46 42
-
Konsumprisindeksen
E-mail: konsumprisindeksen@ssb.no
tel.: (+47) 62 88 56 34
-
Camilla Rochlenge
E-mail: camilla.rochlenge@ssb.no
tel.: (+47) 40 90 23 72
-
Kjersti Nyborg Hov
E-mail: kjersti.nyborg.hov@ssb.no
tel.: (+47) 40 90 23 63
-
Gunnar Larsson
E-mail: gunnar.larsson@ssb.no
tel.: (+47) 40 90 26 79
-
Trym Kristian Økland
E-mail: trym.okland@ssb.no
tel.: (+47) 46 81 09 15