Content
Published:
This is an archived release.
Sales on clothing behind fall in the CPI
The CPI decreased by 0.5 per cent from December 2010 to January 2011, mainly due to lower prices on clothing and food. The CPI rose by 2.0 per cent from January 2010 to January 2011, while CPI-ATE increased by 0.7 per cent in the same period.
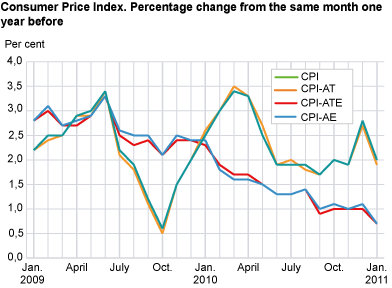
The consumer price index (CPI) was 129.7 (1998=100) per January 2011, compared with 127.1 in the corresponding period 2010. This was equivalent to a year-to-year growth of 2.0 per cent in January 2011, down from 2.8 per cent in December. The year-to year growth in the CPI-ATE was 0.7 per cent in January 2011.
New weights in the CPI from 2011From January 2011 the CPI weights are based on National Account data. Read more about this in article on new weights in the CPI . |
Price decrease on clothing and food behind decline in the CPI
The CPI fell 0.5 per cent from December 2010 to January 2011. The fall was mainly caused by a decrease in prices on clothing and food of 10.0 and 2.4 per cent respectively. Of other significant falls in prices from December to January were airline fares which fell 17.5 per cent and prices on furniture and furnishings with a 6.2 per cent fall. Urban holidays, which are measured within the aggregate package holidays this month, fell in prices together with books and audiovisual equipment.
On the contrary, electricity included grid rent rose 2.9 per cent from December to January where grid rent contributed the most. With updated taxes on tobacco and alcohol, these goods had a rise in prices of 6.3 and 3.5 per cent respectively and contributed to dampen the fall in the CPI as well. January is a month for updating house rentals and this was reflected in increased paid rentals and imputed rentals for owner-occupiers.
In January each year kindergarten fees and prices of after-school care are measured. Read more about the kindergarten fees in both public and private kindergartens .
Higher electricity prices behind the year-to-year growth
The CPI increased by 2.0 per cent from January 2010 to January 2011. The prices on electricity were 27.4 per cent higher in January 2011 compared to January 2010 and contributed most to the year-to-year growth. Imputed rentals for owner-occupiers increased by 2.6 per cent in the same period. In addition prices on operation of personal transport equipment rose by 5.6 per cent. In the same period, prices on tobacco and alcohol together increased by 5.9 per cent, while recreational and cultural services and restaurant services increased 5.1 and 3.1 per cent respectively.
The decrease in prices on clothing and food of 7.2 and 2.6 per cent respectively dampened the year-to-year growth in CPI in January. Audiovisual equipment continued to show falling prices in the period with a 5.5 per cent decrease.
There was a fall in the year-to-year growth of 0.8 percentage points from December 2010 to January 2011. This was caused by a 2.9 per cent rise in electricity prices included grid rent from December 2010 to January 2011, which is weaker than the 11.6 per cent rise from December 2009 to January 2010. A stronger decrease in food prices in January this year compared to last year was also a significant contributor to the decrease in the year-to-year growth. The same effects where measured in imputed rentals for owner-occupiers and prices on clothing.
The year-to-year growth in the CPI-ATE was 0.7 in January 2011.
|
National Account data replaced the Survey of consumer expenditure as main source of weights in the CPI in January 2011. At the same time the referenced base period was changed from July to December, and the CPI will by this have congruent base period to the HICP. With the yearly revision of weights and updated base period, the sample of goods is revised and updated. |
| Weights | Index | Change in per cent | |||||||||||||||||||||||||||||||||||||||||||||||||||||||||||||||||||||||||||||
|---|---|---|---|---|---|---|---|---|---|---|---|---|---|---|---|---|---|---|---|---|---|---|---|---|---|---|---|---|---|---|---|---|---|---|---|---|---|---|---|---|---|---|---|---|---|---|---|---|---|---|---|---|---|---|---|---|---|---|---|---|---|---|---|---|---|---|---|---|---|---|---|---|---|---|---|---|---|---|---|
| January 2011-December 2011 | January 2011 | December 2010-January 2011 | January 2010-January 2011 | ||||||||||||||||||||||||||||||||||||||||||||||||||||||||||||||||||||||||||||
| CPI All-item index | 1 000.0 | 129.7 | -0.5 | 2.0 | |||||||||||||||||||||||||||||||||||||||||||||||||||||||||||||||||||||||||||
| Food and non-alcoholic beverages | 133.1 | 119.6 | -1.9 | -1.6 | |||||||||||||||||||||||||||||||||||||||||||||||||||||||||||||||||||||||||||
| Alcoholic beverages and tobacco | 42.3 | 155.6 | 4.9 | 5.9 | |||||||||||||||||||||||||||||||||||||||||||||||||||||||||||||||||||||||||||
| Clothing and footwear | 56.8 | 52.5 | -9.8 | -6.7 | |||||||||||||||||||||||||||||||||||||||||||||||||||||||||||||||||||||||||||
| Housing, water, electricity, fuels | 214.9 | 165.3 | 1.1 | 6.0 | |||||||||||||||||||||||||||||||||||||||||||||||||||||||||||||||||||||||||||
| Furnishings household equipment | 60.2 | 103.6 | -3.0 | -1.1 | |||||||||||||||||||||||||||||||||||||||||||||||||||||||||||||||||||||||||||
| Health | 30.0 | 153.5 | 0.9 | 3.0 | |||||||||||||||||||||||||||||||||||||||||||||||||||||||||||||||||||||||||||
| Transport | 133.7 | 137.5 | -0.7 | 1.6 | |||||||||||||||||||||||||||||||||||||||||||||||||||||||||||||||||||||||||||
| Communications | 27.5 | 71.1 | 0.1 | -3.3 | |||||||||||||||||||||||||||||||||||||||||||||||||||||||||||||||||||||||||||
| Recreation and culture | 134.8 | 116.2 | -0.6 | 0.7 | |||||||||||||||||||||||||||||||||||||||||||||||||||||||||||||||||||||||||||
| Education | 2.7 | 166.8 | - | 2.3 | |||||||||||||||||||||||||||||||||||||||||||||||||||||||||||||||||||||||||||
| Restaurants and hotels | 50.3 | 152.5 | 0.6 | 3.0 | |||||||||||||||||||||||||||||||||||||||||||||||||||||||||||||||||||||||||||
| Miscellaneous goods and services | 113.8 | 139.3 | 0.7 | 3.0 | |||||||||||||||||||||||||||||||||||||||||||||||||||||||||||||||||||||||||||
| CPI-AE | .. | 122.8 | -0.7 | 0.7 | |||||||||||||||||||||||||||||||||||||||||||||||||||||||||||||||||||||||||||
| CPI-AT | .. | 126.3 | -0.8 | 1.9 | |||||||||||||||||||||||||||||||||||||||||||||||||||||||||||||||||||||||||||
| CPI-ATE | .. | 119.6 | -0.9 | 0.7 | |||||||||||||||||||||||||||||||||||||||||||||||||||||||||||||||||||||||||||
| CPI-ATE sesonal adjusted | .. | 120.5 | -0.1 | ||||||||||||||||||||||||||||||||||||||||||||||||||||||||||||||||||||||||||||
Tables
Contact
-
Statistics Norway's Information Centre
E-mail: informasjon@ssb.no
tel.: (+47) 21 09 46 42
-
Konsumprisindeksen
E-mail: konsumprisindeksen@ssb.no
tel.: (+47) 62 88 56 34
-
Camilla Rochlenge
E-mail: camilla.rochlenge@ssb.no
tel.: (+47) 40 90 23 72
-
Kjersti Nyborg Hov
E-mail: kjersti.nyborg.hov@ssb.no
tel.: (+47) 40 90 23 63
-
Gunnar Larsson
E-mail: gunnar.larsson@ssb.no
tel.: (+47) 40 90 26 79
-
Trym Kristian Økland
E-mail: trym.okland@ssb.no
tel.: (+47) 46 81 09 15