Content
Published:
This is an archived release.
CPI up 0.9 per cent
The CPI rose by 0.9 per cent from August to September 2012. Higher prices of clothing was the main contributor to the increase. The year-to-year growth in the CPI was 0.5 per cent in September, while the CPI-ATE increased by 1.1 per cent in the same period.
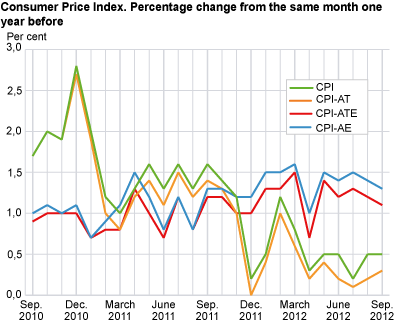
The Consumer Price Index (CPI) was 131.2 (1998=100) as per September 2012, compared with 130.6 in the corresponding period in 2011. This was equivalent to a year-to-year growth of 0.5 per cent in September, unchanged from the previous month. The year-to year growth in the CPI adjusted for tax changes and excluding energy products (CPI-ATE) was 1.1 per cent in September, down 0.1 percentage point from the previous month.
Increased prices of clothing
The CPI rose by 0.9 per cent from August to September 2012. Prices of clothing increased by 8.8 per cent, which can be seen in context with new arrivals. Every category within clothing showed a price increase and clothing for men and women made a particular contribution to the increase.
From August to September food prices rose by 1.4 per cent. The food group milk, cheese and eggs recovered after reduced prices in August. Fresh fruit also experienced a price increase in September. In the same period, prices of airline fares rose by 17.7 per cent. Furniture, furnishings and decorations, carpets and other floor coverings had a price increase of 6.4 per cent. An increase was also observed in user fees for education services of 8.0 per cent since the last survey in September of last year.
A decline in electricity prices helped curb the rise in the CPI from August to September. Electricity including grid rent showed an overall decline in prices of 1.2 per cent. Book prices fell by 7.1 per cent.
CPI up 0.5 per cent the last twelve months
CPI rose by 0.5 per cent from September 2011 to September 2012. The prices of operation of personal transport equipment increased by 5.0 per cent during the same period. It was particularly the subgroups fuels and lubricants for personal transport equipment together with maintenance and repair of personal transport equipment that contributed to the increase.
From September 2011 to September 2012 prices of transport services increased by 8.2 per cent. Other causes for the year-to-year growth were imputed rentals for housing and financial services n.e.c., which had a price increase of 1.6 and 6.2 per cent respectively.
Prices for electricity including grid rent fell 20.1 per cent from September 2011 to September 2012, which was by far the most dampening effect in the CPI growth. Telephone services and clothing experienced a drop in prices of 7.8 and 3.3 per cent respectively.
Changed year-to-year growth
The year-to-year growth in the CPI was unchanged from August to September. Prices of clothing rose less from August to September this year than for the same period last year, and pulled the year-to-year growth down. The price development in electricity including grid rent pulled the year-to-year growth in the opposite direction. The year-to-year growth in the CPI-ATE was 1.1 per cent in September, down 0.1 percentage point.
| Weights. January 2012- December 2012 | Index. September 2012 | Change in per cent | |||||||||||||||||||||||||||||||||||||||||||||||||||||||||||||||||||||||||||||
|---|---|---|---|---|---|---|---|---|---|---|---|---|---|---|---|---|---|---|---|---|---|---|---|---|---|---|---|---|---|---|---|---|---|---|---|---|---|---|---|---|---|---|---|---|---|---|---|---|---|---|---|---|---|---|---|---|---|---|---|---|---|---|---|---|---|---|---|---|---|---|---|---|---|---|---|---|---|---|---|
| August 2012- September 2012 | September 2011- September 2012 | January-September 2011 - January-September 2012 | |||||||||||||||||||||||||||||||||||||||||||||||||||||||||||||||||||||||||||||
| CPI All-item index | 1 000.0 | 131.2 | 0.9 | 0.5 | 0.5 | ||||||||||||||||||||||||||||||||||||||||||||||||||||||||||||||||||||||||||
| Food and non-alcoholic beverages | 131.4 | 124.8 | 1.1 | 0.9 | 1.5 | ||||||||||||||||||||||||||||||||||||||||||||||||||||||||||||||||||||||||||
| Alcoholic beverages and tobacco | 42.1 | 163.0 | 0.1 | 3.0 | 3.3 | ||||||||||||||||||||||||||||||||||||||||||||||||||||||||||||||||||||||||||
| Clothing and footwear | 55.5 | 56.0 | 7.9 | -2.8 | -0.7 | ||||||||||||||||||||||||||||||||||||||||||||||||||||||||||||||||||||||||||
| Housing, water, electricity, fuels | 225.2 | 153.8 | - | -2.5 | -2.8 | ||||||||||||||||||||||||||||||||||||||||||||||||||||||||||||||||||||||||||
| Furnishings household equipment | 59.4 | 106.7 | 2.9 | 0.8 | 0.1 | ||||||||||||||||||||||||||||||||||||||||||||||||||||||||||||||||||||||||||
| Health | 28.7 | 159.6 | 0.2 | 3.2 | 3.2 | ||||||||||||||||||||||||||||||||||||||||||||||||||||||||||||||||||||||||||
| Transport | 143.3 | 145.6 | 1.5 | 3.4 | 2.3 | ||||||||||||||||||||||||||||||||||||||||||||||||||||||||||||||||||||||||||
| Communications | 27.9 | 65.8 | -0.2 | -8.1 | -5.8 | ||||||||||||||||||||||||||||||||||||||||||||||||||||||||||||||||||||||||||
| Recreation and culture | 129.7 | 115.7 | 0.2 | 0.4 | 0.3 | ||||||||||||||||||||||||||||||||||||||||||||||||||||||||||||||||||||||||||
| Education | 2.9 | 187.3 | 8.0 | 8.0 | 4.5 | ||||||||||||||||||||||||||||||||||||||||||||||||||||||||||||||||||||||||||
| Restaurants and hotels | 49.9 | 161.0 | 0.4 | 3.1 | 3.2 | ||||||||||||||||||||||||||||||||||||||||||||||||||||||||||||||||||||||||||
| Miscellaneous goods and services | 104.1 | 146.1 | 0.1 | 3.4 | 3.5 | ||||||||||||||||||||||||||||||||||||||||||||||||||||||||||||||||||||||||||
| CPI-AE | .. | 126.7 | 1.0 | 1.3 | 1.4 | ||||||||||||||||||||||||||||||||||||||||||||||||||||||||||||||||||||||||||
| CPI-AT (July 1999=100) | .. | 127.7 | 1.0 | 0.3 | 0.4 | ||||||||||||||||||||||||||||||||||||||||||||||||||||||||||||||||||||||||||
| CPI-ATE (July 1999=100) | .. | 123.3 | 1.1 | 1.1 | 1.2 | ||||||||||||||||||||||||||||||||||||||||||||||||||||||||||||||||||||||||||
| CPI-ATE seasonal adjusted | .. | 122.9 | 0.1 | ||||||||||||||||||||||||||||||||||||||||||||||||||||||||||||||||||||||||||||
Tables
Contact
-
Statistics Norway's Information Centre
E-mail: informasjon@ssb.no
tel.: (+47) 21 09 46 42
-
Konsumprisindeksen
E-mail: konsumprisindeksen@ssb.no
tel.: (+47) 62 88 56 34
-
Camilla Rochlenge
E-mail: camilla.rochlenge@ssb.no
tel.: (+47) 40 90 23 72
-
Kjersti Nyborg Hov
E-mail: kjersti.nyborg.hov@ssb.no
tel.: (+47) 40 90 23 63
-
Gunnar Larsson
E-mail: gunnar.larsson@ssb.no
tel.: (+47) 40 90 26 79
-
Trym Kristian Økland
E-mail: trym.okland@ssb.no
tel.: (+47) 46 81 09 15