Content
Published:
This is an archived release.
Electricity prices pulls CPI down
The CPI fell by 0.5 per cent from June to July 2012, mainly caused by a fall in electricity prices. The year-to-year growth in the CPI was 0.2 per cent in July, while the CPI-ATE increased by 1.3 per cent in the same period.
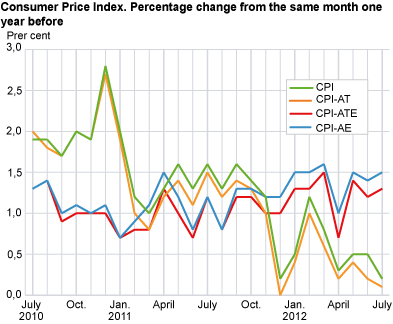
The Consumer Price Index (CPI) was 130.5 (1998=100) as per July 2012, compared with 130.2 in the corresponding period in 2011. This was equivalent to a year-to-year growth of 0.2 per cent in July 2012, down 0.3 percentage points from June. The year-to year growth in the CPI adjusted for tax changes and excluding energy products (CPI-ATE) was 1.3 per cent in July 2012, up 0.1 percentage points from the previous month.
Still decline in electricity prices
The CPI fell by 0.5 per cent from June to July 2012. The main reason for the decline was a price fall on electricity including grid rent of 11.8 per cent. The fall in electricity prices can be attributed to heavy rain and lower consumption due to summer holiday. The prices on clothing and footwear fell by 4.9 per cent from June to July, while accommodation services experienced an 11.1 per cent reduction in prices.
Airline fares pulled the CPI in the opposite direction with a price increase of 22.5 per cent from June to July 2012. Food prices rose by 0.8 per cent, for some food groups this can be seen in context with the upward revision of target prices from this year’s agricultural agreement. In the same period of time imputed rentals for housing increased by 0.2 per cent.
Close to zero growth from July 2011 to July 2012
From July 2011 to July 2012 the CPI rose by 0.2 per cent. The main cause for the low year-to-year growth was the development of electricity prices. Electricity prices including grid rent was 28.4 per cent lower in July 2012 than the case was in July the previous year. The CPI excluding electricity (CPI-AEL) increased by 1.5 per cent from July 2011 to July 2012. This implies that the price on electricity including grid rent pulls the year-to-year growth of the CPI down by 1.3 percentage points.
Audio-visual equipment and telephone services experienced a drop in prices of 5.5 and 6.5 per cent respectively.
Airline fares increased by 24.7 per cent from July 2011 to July 2012, while imputed rentals for housing experienced a rise of 1.8 per cent. In the same period of time financial services n.e.c. and catering services showed a price increase of 6.2 and 4.2 per cent respectively. Other consumption groups which had a positive year-to-year growth were among others, operation of personal transport equipment, passenger transport by road, together with recreational and cultural services.
Changed year-to-year growth
The year-to-year growth in the CPI fell from 0.5 per cent in June to 0.2 per cent in July. The main reason for the decline was that the prices of electricity including grid rent fell by 11.8 per cent from June to July this year, whereas the prices in the corresponding period last year dropped by 6.6 per cent. A weaker price increase on food and non-alcoholic beverages from June to July this year, than for the corresponding period last year, also contributed to pulling the year-to-year growth down.
Airline fares pulled the year-to-year growth in the opposite direction with a price increase of 22.5 per cent from June to July this year, while they fell by 7.0 per cent in the same period last year.
| Weights. January 2012-December 2012 | Index. July 2012 | Change in per cent | |||||||||||||||||||||||||||||||||||||||||||||||||||||||||||||||||||||||||||||
|---|---|---|---|---|---|---|---|---|---|---|---|---|---|---|---|---|---|---|---|---|---|---|---|---|---|---|---|---|---|---|---|---|---|---|---|---|---|---|---|---|---|---|---|---|---|---|---|---|---|---|---|---|---|---|---|---|---|---|---|---|---|---|---|---|---|---|---|---|---|---|---|---|---|---|---|---|---|---|---|
| June 2012-July 2012 | July 2011-July 2012 | January - July 2011 - January - July 2012 | |||||||||||||||||||||||||||||||||||||||||||||||||||||||||||||||||||||||||||||
| CPI All-item index | 1 000.0 | 130.5 | -0.5 | 0.2 | 0.5 | ||||||||||||||||||||||||||||||||||||||||||||||||||||||||||||||||||||||||||
| Food and non-alcoholic beverages | 131.4 | 125.3 | 0.8 | 0.7 | 1.6 | ||||||||||||||||||||||||||||||||||||||||||||||||||||||||||||||||||||||||||
| Alcoholic beverages and tobacco | 42.1 | 162.8 | 0.4 | 3.1 | 3.3 | ||||||||||||||||||||||||||||||||||||||||||||||||||||||||||||||||||||||||||
| Clothing and footwear | 55.5 | 52.9 | -4.9 | 0.6 | -0.5 | ||||||||||||||||||||||||||||||||||||||||||||||||||||||||||||||||||||||||||
| Housing, water, electricity, fuels | 225.2 | 152.8 | -1.9 | -4.0 | -2.7 | ||||||||||||||||||||||||||||||||||||||||||||||||||||||||||||||||||||||||||
| Furnishings household equipment | 59.4 | 105.1 | -0.3 | -0.7 | - | ||||||||||||||||||||||||||||||||||||||||||||||||||||||||||||||||||||||||||
| Health | 28.7 | 158.3 | -0.1 | 3.0 | 3.2 | ||||||||||||||||||||||||||||||||||||||||||||||||||||||||||||||||||||||||||
| Transport | 143.3 | 145.9 | 1.5 | 3.3 | 2.1 | ||||||||||||||||||||||||||||||||||||||||||||||||||||||||||||||||||||||||||
| Communications | 27.9 | 66.7 | - | -6.7 | -5.1 | ||||||||||||||||||||||||||||||||||||||||||||||||||||||||||||||||||||||||||
| Recreation and culture | 129.7 | 115.6 | -0.3 | - | 0.3 | ||||||||||||||||||||||||||||||||||||||||||||||||||||||||||||||||||||||||||
| Education | 2.9 | 173.5 | - | 4.0 | 4.0 | ||||||||||||||||||||||||||||||||||||||||||||||||||||||||||||||||||||||||||
| Restaurants and hotels | 49.9 | 159.1 | -0.8 | 3.1 | 3.2 | ||||||||||||||||||||||||||||||||||||||||||||||||||||||||||||||||||||||||||
| Miscellaneous goods and services | 104.1 | 145.8 | 0.3 | 3.3 | 3.5 | ||||||||||||||||||||||||||||||||||||||||||||||||||||||||||||||||||||||||||
| CPI-AE | .. | 126.3 | 0.1 | 1.5 | 1.4 | ||||||||||||||||||||||||||||||||||||||||||||||||||||||||||||||||||||||||||
| CPI-AT (July 1999=100) | .. | 127.0 | -0.4 | 0.1 | 0.4 | ||||||||||||||||||||||||||||||||||||||||||||||||||||||||||||||||||||||||||
| CPI-ATE (July 1999=100) | .. | 122.8 | - | 1.3 | 1.2 | ||||||||||||||||||||||||||||||||||||||||||||||||||||||||||||||||||||||||||
| CPI-ATE seasonal adjusted | .. | 122.9 | 0.2 | ||||||||||||||||||||||||||||||||||||||||||||||||||||||||||||||||||||||||||||
Tables
Contact
-
Statistics Norway's Information Centre
E-mail: informasjon@ssb.no
tel.: (+47) 21 09 46 42
-
Konsumprisindeksen
E-mail: konsumprisindeksen@ssb.no
tel.: (+47) 62 88 56 34
-
Camilla Rochlenge
E-mail: camilla.rochlenge@ssb.no
tel.: (+47) 40 90 23 72
-
Kjersti Nyborg Hov
E-mail: kjersti.nyborg.hov@ssb.no
tel.: (+47) 40 90 23 63
-
Gunnar Larsson
E-mail: gunnar.larsson@ssb.no
tel.: (+47) 40 90 26 79
-
Trym Kristian Økland
E-mail: trym.okland@ssb.no
tel.: (+47) 46 81 09 15