Content
Published:
This is an archived release.
Energy prices pull CPI up
The CPI rose by 0.2 per cent from October to November 2010, mainly due to increased prices of energy products. From November 2009 to November 2010, the CPI rose by 1.9 per cent, while the CPI-ATE rose 1.0 per cent.
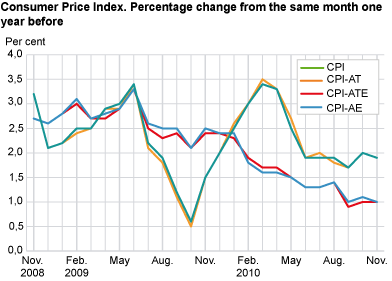
The consumer price index (CPI) was 129.0 (1998=100) as per November 2010, compared to 126.6 in the same month in 2009. This corresponds to a year-to-year growth of 1.9 per cent in November 2010, down by 0.1 percentage point from last month. The year-to year growth in the CPI adjusted for tax changes and excluding energy products (CPI-ATE) was 1.0 per cent, unchanged from October 2010.
Prices on energy products behind monthly growth in the CPI
The CPI rose 0.2 per cent from October to November 2010. Electricity including grid rent and fuels and lubricants were the main contributors to the growth in price increases of 2.7 and 1.5 per cent respectively. Prices of clothing and footwear rose 0.5 per cent from October to November this year. There were also minor increases in prices of airline fares and newspapers, books and stationery, which contributed to the monthly change in the CPI.
Some goods and services had price falls from October to November; food prices fell 0.2 per cent, prices of audiovisual equipment 0.9 per cent and in addition there were some minor falls in prices of regular maintenance and repair of dwellings.
Prices of housing and energy goods for warming houses behind year-to-year growth
From November 2009 to November 2010, the CPI rose by 1.9 per cent. Behind the growth were higher prices of electricity, gas and other fuels, which rose by 17.3 per cent, and a rise in imputed rentals and actual rentals for housing of 3.4 per cent. Regular maintenance and repair of dwellings also showed increased prices in the period of 2.6 per cent. Of other goods and services with increased prices were operation of personal transport equipment with 4.1 per cent, and recreational and cultural services with 6.4 per cent. In addition, higher prices of both insurance and package holidays also contributed to the growth.
From November 2009 to November 2010, the prices development of some goods and services dampened the year-to-year growth. Clothing and footwear had a 5.3 per cent decrease in prices while food prices fell 1.2 per cent. Audiovisual equipment, telephone services together with other goods and services showed price falls in the period.
The year-to-year growth in the CPI in November was 0.1 percentage point weaker than in October. While food and non-alcoholic beverages showed increased prices from October to November in 2009, the prices fell in the corresponding period this year. The prices of electricity including grid rent and fuels and lubricants rose less this year than the corresponding period last year, and in so doing contributed to the fall in the year-to-year growth.
The CPI-ATE rose 1.0 per cent from November 2009 to November 2010 and was thus unchanged from October. While lower prices of food dampened the growth in the CPI-ATE, the prices of clothing and footwear together with airline fares kept the year-to-year growth up.
| Weights | Index | Change in per cent | |||||||||||||||||||||||||||||||||||||||||||||||||||||||||||||||||||||||||||||
|---|---|---|---|---|---|---|---|---|---|---|---|---|---|---|---|---|---|---|---|---|---|---|---|---|---|---|---|---|---|---|---|---|---|---|---|---|---|---|---|---|---|---|---|---|---|---|---|---|---|---|---|---|---|---|---|---|---|---|---|---|---|---|---|---|---|---|---|---|---|---|---|---|---|---|---|---|---|---|---|
| August 2009- December 2010 |
November 2010 | October 2010- November 2010 |
November 2009- November 2010 |
January-November 2009- January-November 2010 |
|||||||||||||||||||||||||||||||||||||||||||||||||||||||||||||||||||||||||||
| CPI All-item index | 1 000.0 | 129.0 | 0.2 | 1.9 | 2.4 | ||||||||||||||||||||||||||||||||||||||||||||||||||||||||||||||||||||||||||
| Food and non-alcoholic beverages | 114.4 | 121.9 | -0.3 | -0.8 | 0.3 | ||||||||||||||||||||||||||||||||||||||||||||||||||||||||||||||||||||||||||
| Alcoholic beverages and tobacco | 25.5 | 148.3 | 0.1 | 3.3 | 3.5 | ||||||||||||||||||||||||||||||||||||||||||||||||||||||||||||||||||||||||||
| Clothing and footwear | 56.3 | 58.7 | 0.5 | -5.3 | -3.8 | ||||||||||||||||||||||||||||||||||||||||||||||||||||||||||||||||||||||||||
| Housing, water, electricity, fuels | 304.7 | 159.1 | 0.4 | 5.2 | 5.1 | ||||||||||||||||||||||||||||||||||||||||||||||||||||||||||||||||||||||||||
| Furnishings household equipment | 61.8 | 106.9 | 0.1 | -0.2 | -0.3 | ||||||||||||||||||||||||||||||||||||||||||||||||||||||||||||||||||||||||||
| Health | 26.1 | 152.1 | 0.1 | 2.5 | 2.6 | ||||||||||||||||||||||||||||||||||||||||||||||||||||||||||||||||||||||||||
| Transport | 172.1 | 137.0 | 0.4 | 1.7 | 2.1 | ||||||||||||||||||||||||||||||||||||||||||||||||||||||||||||||||||||||||||
| Communications | 22.7 | 71.0 | -0.1 | -3.5 | -2.0 | ||||||||||||||||||||||||||||||||||||||||||||||||||||||||||||||||||||||||||
| Recreation and culture | 120.6 | 115.9 | - | 0.9 | 2.3 | ||||||||||||||||||||||||||||||||||||||||||||||||||||||||||||||||||||||||||
| Education | 2.4 | 166.8 | - | 2.3 | 3.0 | ||||||||||||||||||||||||||||||||||||||||||||||||||||||||||||||||||||||||||
| Restaurants and hotels | 35.3 | 151.8 | - | 2.8 | 3.1 | ||||||||||||||||||||||||||||||||||||||||||||||||||||||||||||||||||||||||||
| Miscellaneous goods and services | 58.1 | 138.1 | 0.1 | 2.9 | 3.2 | ||||||||||||||||||||||||||||||||||||||||||||||||||||||||||||||||||||||||||
| CPI-AE | .. | 123.5 | - | 1.0 | 1.4 | ||||||||||||||||||||||||||||||||||||||||||||||||||||||||||||||||||||||||||
| CPI-AT | .. | 125.9 | 0.2 | 1.9 | 2.4 | ||||||||||||||||||||||||||||||||||||||||||||||||||||||||||||||||||||||||||
| CPI-ATE | .. | 120.5 | 0.1 | 1.0 | 1.4 | ||||||||||||||||||||||||||||||||||||||||||||||||||||||||||||||||||||||||||
| CPI-ATE sesonal adjusted | 120.5 | 0.1 | |||||||||||||||||||||||||||||||||||||||||||||||||||||||||||||||||||||||||||||
Tables
Contact
-
Statistics Norway's Information Centre
E-mail: informasjon@ssb.no
tel.: (+47) 21 09 46 42
-
Konsumprisindeksen
E-mail: konsumprisindeksen@ssb.no
tel.: (+47) 62 88 56 34
-
Camilla Rochlenge
E-mail: camilla.rochlenge@ssb.no
tel.: (+47) 40 90 23 72
-
Kjersti Nyborg Hov
E-mail: kjersti.nyborg.hov@ssb.no
tel.: (+47) 40 90 23 63
-
Gunnar Larsson
E-mail: gunnar.larsson@ssb.no
tel.: (+47) 40 90 26 79
-
Trym Kristian Økland
E-mail: trym.okland@ssb.no
tel.: (+47) 46 81 09 15