Content
Published:
This is an archived release.
Seasonal sales caused continued decrease in CPI
The CPI decreased by 0.3 per cent from December 2008 to January 2009, mainly due to seasonal sales on clothing. The year-to-year growth in the CPI was 2.2 per cent in January 2009, while the CPI-ATE increased by 2.8 per cent.
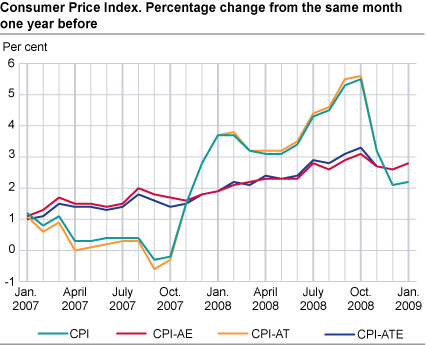
The consumer price index (CPI) was 124.0 (1998=100) as per January 2009 compared to 121.3 in the corresponding month in the previous year. This is equivalent to a year-to-year growth of 2.2 per cent in January, up 0.1 percentage point from December. The year-to year growth in the CPI-ATE was 2.8 per cent in January 2009 compared with 2.6 per cent in December 2008.
Prices on clothing fell by 10.0 per cent from December 2008 to January 2009
The CPI decreased by 0.3 per cent from December 2008 to January 2009, caused among other factors by seasonal sales on clothing. Prices on clothing fell by 10.0 per cent and was the largest contributor to the decrease. In addition, there where lower prices on footwear, furniture and household textiles. Airline fares fell by 16.9 per cent, while the price of electricity including transport fell by 3.0 per cent in the same period.
Several factors contributed to dampen the decrease in the CPI from December to January. Increased imputed rentals of owner-occupiers and higher prices on motor cars and fuels were the main contributors. In addition there were increased prices on recreational and cultural services. Kindergarten fees, both private and public, had only a marginal growth from August 2008. See “Households’ payments in kindergartens. Rates of change. January 2009”. On the other hand there was a strong increase in prices of payments for after-school care in January.
The CPI-AT decreased by 0.5 per cent from December to January. Changes in taxes contributed to pulling the CPI up by 0.2 percentage points. For tobacco and alcoholic beverages the changes in taxes contributed to a price increase in CPI by 3.2 and 2.5 per cent respectively. The increase in taxes on tobacco and alcoholic beverages is based on the expected inflation for 2009, except for snuff and chewing tobacco. For non-alcoholic beverages the tax increase was 61.3 per cent, which means that prices for mineral waters and soft drinks increased by 8.5 per cent. For new cars there has been a change in tax structure. Prices on motor cars increased by 1.3 per cent from December 2008 to January 2009.
Year-to-year change: Imputed rentals and food behind the CPI growth
The CPI rose by 2.2 per cent from January 2008 to January 2009. Imputed rentals and food were the main contributors to the year-to-year change, and had a growth of 4.2 and 4.7 per cent respectively. Services of transport, recreation and culture and restaurants also contributed to the price growth in the CPI the last twelve months.
Prices on clothing decreased by 8.1 per cent and contributed to dampen the increase in CPI from January 2008 to January 2009. Other consumer areas that had a price decrease the last twelve months were audio-visual equipment and telephone services, at 9.3 and 11.1 per cent respectively.
Low increase in the year-to-year growth
The year-to-year growth rose from 2.1 per cent in December 2008 to 2.2 per cent in January 2009, mainly due to the increase in rentals. Imputed rentals increased by 1.2 per cent in January 2009, while there was a marginal decrease in January 2008.
The change in the year-to-year growth of the CPI-ATE was 0.2 percentage points, from 2.6 per cent in December 2008 to 2.8 per cent in January 2009. The CPI-AT rose by 0.1 percentage point in the same period.
|
Weights
August 2008- July 2009 |
Index
January 2009 |
Change in per cent | |||||||||||||||||||||||||||||||||||||
|---|---|---|---|---|---|---|---|---|---|---|---|---|---|---|---|---|---|---|---|---|---|---|---|---|---|---|---|---|---|---|---|---|---|---|---|---|---|---|---|
|
December 2008-
January 2009 |
January 2008-
January 2009 |
||||||||||||||||||||||||||||||||||||||
| CPI All-item index | 1 000.0 | 124.0 | -0.3 | 2.2 | |||||||||||||||||||||||||||||||||||
| Food and non-alcoholic beverages | 111.8 | 118.6 | -0.4 | 5.0 | |||||||||||||||||||||||||||||||||||
| Alcoholic beverages and tobacco | 26.8 | 141.3 | 2.7 | 5.1 | |||||||||||||||||||||||||||||||||||
| Clothing and footwear | 59.1 | 55.6 | -9.7 | -7.5 | |||||||||||||||||||||||||||||||||||
| Housing, water, electricity, fuels | 295.0 | 152.4 | 0.3 | 1.8 | |||||||||||||||||||||||||||||||||||
| Furnishings household equipment | 63.3 | 104.1 | -1.1 | 4.2 | |||||||||||||||||||||||||||||||||||
| Health | 27.4 | 145.0 | 1.2 | 2.5 | |||||||||||||||||||||||||||||||||||
| Transport | 178.8 | 131.8 | 0.4 | 1.9 | |||||||||||||||||||||||||||||||||||
| Communications | 20.9 | 73.7 | 0.5 | -3.9 | |||||||||||||||||||||||||||||||||||
| Recreation and culture | 120.2 | 111.4 | 0.1 | 3.1 | |||||||||||||||||||||||||||||||||||
| Education | 2.7 | 157.9 | - | 4.6 | |||||||||||||||||||||||||||||||||||
| Restaurants and hotels | 34.4 | 144.3 | 1.2 | 4.9 | |||||||||||||||||||||||||||||||||||
| Miscellaneous goods and services | 59.6 | 130.3 | 0.7 | 4.1 | |||||||||||||||||||||||||||||||||||
| CPI-AE | 119.1 | -0.3 | 2.8 | ||||||||||||||||||||||||||||||||||||
| CPI-AT | 120.9 | -0.5 | 2.2 | ||||||||||||||||||||||||||||||||||||
| CPI-ATE | 116.1 | -0.5 | 2.8 | ||||||||||||||||||||||||||||||||||||
| CPI-ATE seasonal adjusted | 117.0 | 0.3 | |||||||||||||||||||||||||||||||||||||
Contact
-
Statistics Norway's Information Centre
E-mail: informasjon@ssb.no
tel.: (+47) 21 09 46 42
-
Konsumprisindeksen
E-mail: konsumprisindeksen@ssb.no
tel.: (+47) 62 88 56 34
-
Camilla Rochlenge
E-mail: camilla.rochlenge@ssb.no
tel.: (+47) 40 90 23 72
-
Kjersti Nyborg Hov
E-mail: kjersti.nyborg.hov@ssb.no
tel.: (+47) 40 90 23 63
-
Gunnar Larsson
E-mail: gunnar.larsson@ssb.no
tel.: (+47) 40 90 26 79
-
Trym Kristian Økland
E-mail: trym.okland@ssb.no
tel.: (+47) 46 81 09 15