Content
Published:
This is an archived release.
Electricity pulled CPI up
The CPI rose by 0.4 per cent from September to October 2008. Prices of electricity contributed most to the rise. From October 2007 to October 2008 the CPI rose by 5.5 per cent. The CPI-ATE has increased by 3.3 per cent in the past twelve months.
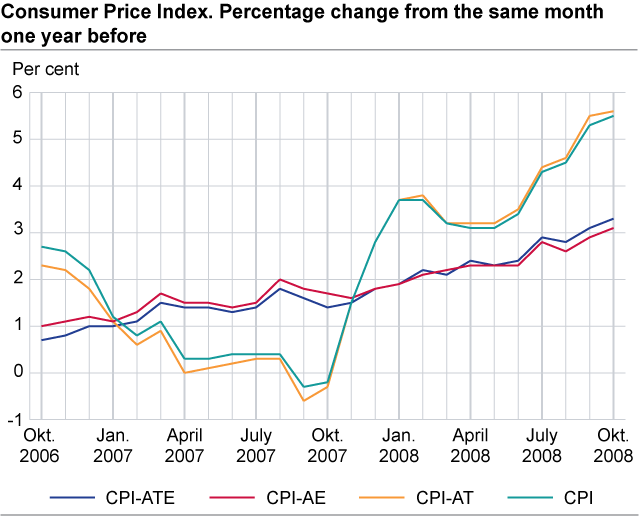
The consumer price index (CPI) was 125.4 (1998=100) per October 2008 compared with 118.9 at the same time last year. This is equivalent to a year-to-year growth of 5.5 per cent, up 0.2 percentage points from September. The year-to year growth in the CPI-ATE was 3.3 per cent in October 2008 compared with 3.1 per cent in September. The CPI-ATE rose by 0.3 per cent from September to October 2008.
Continuing rise in prices of electricity
The CPI rose by 0.4 per cent from September to October 2008. Electricity including grid rent was once again the main contributor with a rise of 6.7 per cent in prices. Especially standard variable contracts on electricity showed an expanding development this month, while spot price contracts registered a price decrease. Other important contributors to the rise in CPI this month was higher prices of fish, clothing and footwear and leisure and garden items.
Prices of fuels and lubricants fell by 3.6 per cent in October, and were the main contributors in dampening the rise in the CPI. Falling prices on books, fruit and airline fares also slowed down the growth.
Still high year-to-year growth
The CPI rose by 5.5 per cent from October 2007 to October 2008. As last month, the growth can mainly be explained by substantial higher prices on electricity this month compared to the same month last year. Electricity including grid rent rose by 61.1 per cent in the period, and contributed with 2.0 percentage points to the total growth in the CPI.
Both food and maintenance of transport equipment showed an increase on a yearly basis with growth in prices of 6.2 and 10.1 per cent respectively. Other groups of goods also recorded higher prices, most notably transport services, garden and leisure items and services and restaurants.
Some goods and services pulled the CPI in the opposite direction. Prices on clothing fell by 5.3 per cent, and audiovisual equipment fell by 9.9 per cent since October last year. The prices of telephone services also decreased.
Change in the year-to-year growth
The year-to-year growth in the CPI rose by 0.2 percentage points from September to October 2008. This was mainly due to the price development on food. While prices went down 1.2 per cent from September to October last year, they rose marginally in the same period this year.
| Weights | Index | Change in per cent | |||||||||||||||||||||||||||||||||||||
|---|---|---|---|---|---|---|---|---|---|---|---|---|---|---|---|---|---|---|---|---|---|---|---|---|---|---|---|---|---|---|---|---|---|---|---|---|---|---|---|
|
August 2008-
July 2009 |
October 2008 |
September 2008-
October 2008 |
October 2007-
October 2008 |
January-October 2007-
January-October 2008 |
|||||||||||||||||||||||||||||||||||
| CPI All-item index | 1 000.0 | 125.4 | 0.4 | 5.5 | 4.0 | ||||||||||||||||||||||||||||||||||
| Food and non-alcoholic beverages | 111.8 | 118.8 | 0.1 | 5.7 | 4.1 | ||||||||||||||||||||||||||||||||||
| Alcoholic beverages and tobacco | 26.8 | 137.5 | 0.1 | 4.7 | 3.7 | ||||||||||||||||||||||||||||||||||
| Clothing and footwear | 59.1 | 63.0 | 0.8 | -4.4 | -3.4 | ||||||||||||||||||||||||||||||||||
| Housing, water, electricity, fuels | 295.0 | 153.1 | 1.1 | 10.4 | 7.5 | ||||||||||||||||||||||||||||||||||
| Furnishings household equipment | 63.3 | 104.8 | 0.4 | 3.6 | 3.0 | ||||||||||||||||||||||||||||||||||
| Health | 27.4 | 142.8 | 0.1 | 3.0 | 3.3 | ||||||||||||||||||||||||||||||||||
| Transport | 178.8 | 134.0 | -0.5 | 5.0 | 4.3 | ||||||||||||||||||||||||||||||||||
| Communications | 20.9 | 80.5 | -0.2 | - | -4.7 | ||||||||||||||||||||||||||||||||||
| Recreation and culture | 120.2 | 110.8 | 0.1 | 2.7 | 1.4 | ||||||||||||||||||||||||||||||||||
| Education | 2.7 | 157.9 | - | 4.6 | 2.1 | ||||||||||||||||||||||||||||||||||
| Restaurants and hotels | 34.4 | 143.3 | 0.5 | 5.4 | 5.1 | ||||||||||||||||||||||||||||||||||
| Miscellaneous goods and services | 59.6 | 128.9 | 0.2 | 4.2 | 3.5 | ||||||||||||||||||||||||||||||||||
| CPI-AE | 119.6 | 0.3 | 3.1 | 2.4 | |||||||||||||||||||||||||||||||||||
| CPI-AT | 122.5 | 0.3 | 5.6 | 4.1 | |||||||||||||||||||||||||||||||||||
| CPI-ATE | 116.8 | 0.3 | 3.3 | 2.5 | |||||||||||||||||||||||||||||||||||
| CPI-ATE sesonal adjusted | 116.6 | 0.3 | |||||||||||||||||||||||||||||||||||||
Contact
-
Statistics Norway's Information Centre
E-mail: informasjon@ssb.no
tel.: (+47) 21 09 46 42
-
Konsumprisindeksen
E-mail: konsumprisindeksen@ssb.no
tel.: (+47) 62 88 56 34
-
Camilla Rochlenge
E-mail: camilla.rochlenge@ssb.no
tel.: (+47) 40 90 23 72
-
Kjersti Nyborg Hov
E-mail: kjersti.nyborg.hov@ssb.no
tel.: (+47) 40 90 23 63
-
Gunnar Larsson
E-mail: gunnar.larsson@ssb.no
tel.: (+47) 40 90 26 79
-
Trym Kristian Økland
E-mail: trym.okland@ssb.no
tel.: (+47) 46 81 09 15