Content
Published:
This is an archived release.
High change rates in CPI
The CPI rose by 1.5 per cent from August to September 2008. Prices of electricity, clothing and transport services contributed most to the rise. From September 2007 to September 2008 the CPI rose by 5.3 per cent. The CPI-ATE has increased by 3.1 per cent in the past twelve months.
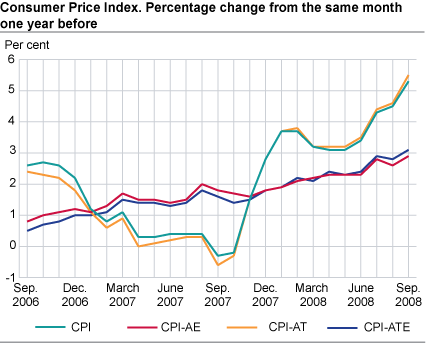
The consumer price index (CPI) was 124.9 (1998=100) per September 2008 compared with 118.6 at the same time last year. This is equivalent to a year-to-year growth of 5.3 per cent, up 0.8 percentage points from August. The year-to year growth in the CPI-ATE was 3.1 per cent in September 2008 compared with 2.8 per cent in August 2008. The CPI-ATE rose by 1.0 per cent from August to September 2008.
Prices on electricity caused growth in the CPI
The CPI rose by 1.5 per cent from August to September 2008. Electricity including grid rent was once again the main contributor with a rise of 13.5 per cent in prices. Especially spot price contracts on electricity showed an expanding development.
Another considerable contributor to the rise in CPI this month was prices on clothing with an increase of 7.7 per cent. This is not unexpected considered the sales activity in the late summer months. Airline fares rose from August to September by 23.0 per cent. Among others, a rise in prices on furniture, books, hotel services and fees paid to private education institutions contributed to the high monthly change in the CPI.
Year-to-year growth highest in 20 years
The CPI rose by 5.3 per cent from September 2007 to September 2008. This is the highest year-to-year growth since December 1988. The growth can mainly be explained by substantial higher prices on electricity this September compared to the same month last year. Electricity including grid rent rose by 62.7 per cent in the period and the rise was particularly on spot price contracts on electricity. Both fuel and lubricants and airline fares showed an increase on a yearly basis with growth in prices on 12.9 and 10.4 per cent respectively.
Some few goods and services pulled in the opposite direction. Prices on audiovisual equipment fell by 10.1 per cent since September last year while clothing and telephone services fell by 4.5 and 3.3 per cent respectively.
Considerable change in year-to-year growth
The year-to-year growth in the CPI rose by 0.8 percentage points from August to September 2008 mainly due to electricity prices. While the prices on electricity including grid rent only changed by 0.7 percent from August to September in 2007 the change was 13.5 per cent in the same period this year. Books, transport services and food also contributed to the high change in year-to-year growth in September.
| Weights | Index | Change in per cent | |||||||||||||||||||||||||||||||||||||
|---|---|---|---|---|---|---|---|---|---|---|---|---|---|---|---|---|---|---|---|---|---|---|---|---|---|---|---|---|---|---|---|---|---|---|---|---|---|---|---|
|
August 2008-
July 2009 |
September 2008 |
August 2008-
September 2008 |
September 2007-
September 2008 |
January-September 2007-
January-September 2008 |
|||||||||||||||||||||||||||||||||||
| CPI All-item index | 1 000.0 | 124.9 | 1.5 | 5.3 | 3.8 | ||||||||||||||||||||||||||||||||||
| Food and non-alcoholic beverages | 111.8 | 118.7 | 0.5 | 4.4 | 3.9 | ||||||||||||||||||||||||||||||||||
| Alcoholic beverages and tobacco | 26.8 | 137.4 | 0.3 | 4.8 | 3.5 | ||||||||||||||||||||||||||||||||||
| Clothing and footwear | 59.1 | 62.5 | 7.0 | -3.5 | -3.3 | ||||||||||||||||||||||||||||||||||
| Housing, water, electricity, fuels | 295.0 | 151.4 | 2.0 | 10.4 | 7.1 | ||||||||||||||||||||||||||||||||||
| Furnishings household equipment | 63.3 | 104.4 | 1.2 | 3.4 | 3.1 | ||||||||||||||||||||||||||||||||||
| Health | 27.4 | 142.6 | -0.2 | 2.8 | 3.4 | ||||||||||||||||||||||||||||||||||
| Transport | 178.8 | 134.7 | 1.1 | 5.2 | 4.2 | ||||||||||||||||||||||||||||||||||
| Communications | 20.9 | 80.7 | -0.4 | -0.5 | -5.2 | ||||||||||||||||||||||||||||||||||
| Recreation and culture | 120.2 | 110.7 | 0.5 | 2.8 | 1.2 | ||||||||||||||||||||||||||||||||||
| Education | 2.7 | 157.9 | 4.6 | 4.6 | 1.8 | ||||||||||||||||||||||||||||||||||
| Restaurants and hotels | 34.4 | 142.6 | 1.0 | 5.2 | 5.0 | ||||||||||||||||||||||||||||||||||
| Miscellaneous goods and services | 59.6 | 128.6 | 0.2 | 4.0 | 3.4 | ||||||||||||||||||||||||||||||||||
| CPI-AE | 119.3 | 1.0 | 2.9 | 2.3 | |||||||||||||||||||||||||||||||||||
| CPI-AT | 122.1 | 1.6 | 5.5 | 3.9 | |||||||||||||||||||||||||||||||||||
| CPI-ATE | 116.5 | 1.0 | 3.1 | 2.4 | |||||||||||||||||||||||||||||||||||
| CPI-ATE seasonal adjusted | 116.3 | 0.4 | |||||||||||||||||||||||||||||||||||||
Contact
-
Statistics Norway's Information Centre
E-mail: informasjon@ssb.no
tel.: (+47) 21 09 46 42
-
Konsumprisindeksen
E-mail: konsumprisindeksen@ssb.no
tel.: (+47) 62 88 56 34
-
Camilla Rochlenge
E-mail: camilla.rochlenge@ssb.no
tel.: (+47) 40 90 23 72
-
Kjersti Nyborg Hov
E-mail: kjersti.nyborg.hov@ssb.no
tel.: (+47) 40 90 23 63
-
Gunnar Larsson
E-mail: gunnar.larsson@ssb.no
tel.: (+47) 40 90 26 79
-
Trym Kristian Økland
E-mail: trym.okland@ssb.no
tel.: (+47) 46 81 09 15