Content
Published:
This is an archived release.
Seasonal sales behind fall in CPI
The consumer price index fell by 0.4 per cent from December to January. The decrease was mainly due to seasonal sales on clothing, shoes and furniture. The CPI rose by 3.7 per cent from January 2007 to January 2008. The CPI adjusted for tax changes and excluding energy products (CPI-ATE) rose by 1.9 per cent in the past twelve months.
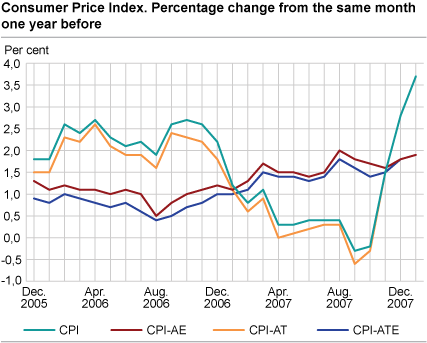
The CPI was 121.3 (1998=100) per January 2008 compared with 117.0 at the same time last year. This is equivalent to a year-to-year growth of 3.7 per cent, up 0.9 percentage points from December. The year-to-year growth in the CPI-ATE was 1.9 per cent in January 2008.
Sales on clothing and furniture
The CPI fell by 0.4 per cent from December to January. Sales activities on clothing, shoes and furniture were the main contributors to the decrease, falling by 9.8 and 3.7 per cent respectively. In addition, airline fares and prices of audiovisual equipment and food contributed to the decrease this month.
Despite the fall in the CPI in January, many goods and services pulled in the opposite direction. Purchases of vehicles and costs related to operation of personal transport equipment increased by 1.1 and 0.9 per cent respectively, while prices of electricity rose further in January with 2.1 per cent from December. An adjustment of taxes on tobacco and alcohol was followed by price increases of 2.7 and 1.9 per cent respectively. For most products this tax adjustment represented the expected inflation for 2008, except for snuff and chewing tobacco, for which taxes increased by 13.3 per cent from 2007 to 2008.
Various health care services and social services are among the products which are measured in the January index. Rates for dental services increased by 2.0 per cent. Payment for after-school care also showed a slight increase, while kindergarten fees have been stable since the last adjustment of maximum fees in 2007, see Household payments in kindergartens .
Year-to-year change: Electricity prices behind growth in CPI
The CPI rose by 3.7 per cent from January 2007 to January 2008. Electricity, including the cost of transport, continued to be the main contributor to the growth with an increase in prices of 26.8 per cent. Several other goods and services pulled in the same direction although the growth was not as sharp as for electricity. Costs related to operation of personal transport equipment rose by 9.4 per cent while goods and services for routine household maintenance rose by 7.6 per cent. Restaurants and hotels had an overall increase in prices of 6.4 per cent.
Pulling in the opposite direction, clothing and audiovisual equipment had the strongest downward effect on the CPI. Prices of audiovisual equipment fell by 7.4 per cent from January 2007 to January 2008, while clothing prices fell by 3.4 per cent. Communication services such as postal services and telecommunication equipment pulled in the same direction and fell by 6.8 per cent. Prices of transportation services also had a downward effect on the year-to year change.
The year-to-year growth in the CPI rose by 0.9 percentage points from 2.8 in December 2007 to 3.7 in January 2008. This was mainly driven by prices of electricity, which rose by 2.1 per cent. In comparison, the electricity prices fell by 14.8 per cent in January last year.
The year-to-year growth in the CPI-ATE rose by 1.9 per cent from January 2007 to January 2008, and the CPI-AT rose by 3.7 per cent in the same period.
| Weights | Index | Change in per cent | |||||||||||||||||||||||||||||||||||||
|---|---|---|---|---|---|---|---|---|---|---|---|---|---|---|---|---|---|---|---|---|---|---|---|---|---|---|---|---|---|---|---|---|---|---|---|---|---|---|---|
|
August 2007-
July 2008 |
January 2008 |
December 2007-
January 2008 |
January 2007-
January 2008 |
Yearly growth
2006-2007 |
|||||||||||||||||||||||||||||||||||
| CPI All-item index | 1 000.0 | 121.3 | -0.4 | 3.7 | 0.8 | ||||||||||||||||||||||||||||||||||
| Food and non-alcoholic beverages | 113.8 | 113.0 | -0.3 | 2.6 | 2.6 | ||||||||||||||||||||||||||||||||||
| Alcoholic beverages and tobacco | 28.0 | 134.4 | 2.2 | 2.8 | 1.5 | ||||||||||||||||||||||||||||||||||
| Clothing and footwear | 58.4 | 60.1 | -9.8 | -2.8 | -5.1 | ||||||||||||||||||||||||||||||||||
| Housing, water, electricity, fuels | 280.7 | 149.7 | 0.5 | 8.0 | -0.9 | ||||||||||||||||||||||||||||||||||
| Furnishings household equipment | 63.4 | 99.9 | -1.6 | 2.3 | 1.9 | ||||||||||||||||||||||||||||||||||
| Health | 29.1 | 141.4 | 1.8 | 3.5 | 2.5 | ||||||||||||||||||||||||||||||||||
| Transport | 180.0 | 129.4 | 0.8 | 3.6 | 1.9 | ||||||||||||||||||||||||||||||||||
| Communications | 25.4 | 76.7 | -1.0 | -6.8 | -2.0 | ||||||||||||||||||||||||||||||||||
| Recreation and culture | 121.9 | 108.0 | -1.0 | 0.4 | 0.9 | ||||||||||||||||||||||||||||||||||
| Education | 3.2 | 150.9 | - | 1.4 | 2.0 | ||||||||||||||||||||||||||||||||||
| Restaurants and hotels | 35.2 | 137.6 | 0.6 | 6.4 | 4.3 | ||||||||||||||||||||||||||||||||||
| Miscellaneous goods and services | 60.9 | 125.2 | 0.5 | 2.5 | 2.0 | ||||||||||||||||||||||||||||||||||
| CPI-AE | 115.8 | -0.6 | 1.9 | 1.6 | |||||||||||||||||||||||||||||||||||
| CPI-AT | 118.3 | -0.6 | 3.7 | 0.5 | |||||||||||||||||||||||||||||||||||
| CPI-ATE | 112.9 | -0.7 | 1.9 | 1.4 | |||||||||||||||||||||||||||||||||||
| CPI-ATE sesonal adjusted | 113.6 | 0.1 | |||||||||||||||||||||||||||||||||||||
Contact
-
Statistics Norway's Information Centre
E-mail: informasjon@ssb.no
tel.: (+47) 21 09 46 42
-
Konsumprisindeksen
E-mail: konsumprisindeksen@ssb.no
tel.: (+47) 62 88 56 34
-
Camilla Rochlenge
E-mail: camilla.rochlenge@ssb.no
tel.: (+47) 40 90 23 72
-
Kjersti Nyborg Hov
E-mail: kjersti.nyborg.hov@ssb.no
tel.: (+47) 40 90 23 63
-
Gunnar Larsson
E-mail: gunnar.larsson@ssb.no
tel.: (+47) 40 90 26 79
-
Trym Kristian Økland
E-mail: trym.okland@ssb.no
tel.: (+47) 46 81 09 15