Content
Published:
This is an archived release.
Reduced prices on energy products
The consumer price index (CPI) fell by 0.1 per cent from July to August. The decrease is mainly attributable to lower prices on energy products. In the last twelve months the CPI increased by 0.4 per cent, while the CPI adjusted for tax changes and excluding energy products (CPI-ATE) increased by 1.8 per cent.
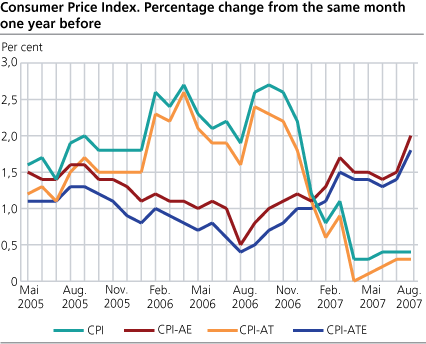
The CPI was 117.8 (1998=100) per August 2007 compared with 117.3 at the same time last year. This is equivalent to a growth of 0.4 per cent, unchanged from July. The year-to-year growth in the CPI-ATE was 1.8 per cent in August, up by 0.4 percentage points from July.
Reduced prices on energy products
The prices of electricity tariffs included transfer showed a decrease of 3.2 per cent from July to August. The petrol prices fell by 1.8 per cent, after a continued price growth since January 2007.
Airline fares showed a decrease of 7.6 per cent from July to August. Due to sales offers, the prices of furniture also reduced the CPI last month.
With a price increase of 1.4 per cent, goods connected to maintenance and repair of dwellings was the main contributor to dampen the decrease in the total CPI in August. Prices of accommodation services increased by 8.8 per cent, mainly because the summer offers ended. Higher prices on dental services, day care services in elementary schools and kindergarten fees offset the decrease in the total CPI in August as well. Prices on dental services, day care services in elementary schools and Kindergarten fees are surveyed in January and August every year.
Consumer prices up 0.4 per cent over last twelve months
The CPI increased by 0.4 per cent from August 2006 to August 2007. Goods and services connected to maintenance and repair of dwellings together with food and non-alcoholic beverages were among the most significant factors behind the CPI growth. Prices on goods and services connected to maintenance and repair of dwellings increased by 8.2 and 5.5 per cent respectively, whereas the prices of food and non-alcoholic beverages rose by 3.9 per cent since August last year.
Services related to recreation and culture as well as hotel and restaurants showed a price increase of 6.7 and 5.1 per cent respectively. Actual and imputed rentals for housing also contributed to the growth in the CPI.
Electricity was the main contributor to moderate the year-to-year growth in the CPI, with a price fall of 31.3 per cent from August last year to August this year. CPI adjusted for electricity had a growth of 1.8 percent in the same period. With the continual price decrease during several months, the prices of electricity have reached the level of October 2002.
Clothing and audiovisual equipments dampened the CPI growth with significant price decreases.
The year-to-year growth in the CPI-ATE rose from 1.4 per cent in July to 1.8 per cent in August, while CPI adjusted for tax changes (CPI-AT) remained unchanged from July at 0.3 per cent.
New weights in CPI
The weights in the CPI are revised yearly in August based on average expenditure shares. From August 2007 to July 2008 the weights are based on the Household Budget Survey in 2004, 2005 and 2006. See New weights .
| The consumer price index. 1998 = 100 |
| Weights | Index | Change in per cent | |||||||||||||||||||||||||||||||||||||
|---|---|---|---|---|---|---|---|---|---|---|---|---|---|---|---|---|---|---|---|---|---|---|---|---|---|---|---|---|---|---|---|---|---|---|---|---|---|---|---|
| August 2007 - July 2008 | August 2007 | July 2007 - August 2007 | August 2006 - August 2007 | Jan.- Aug. 2006 - Jan.- Aug. 2007 | |||||||||||||||||||||||||||||||||||
| CPI All-item index | 1 000.0 | 117.8 | -0.1 | 0.4 | 0.6 | ||||||||||||||||||||||||||||||||||
| Food and non-alcoholic beverages | 113.8 | 113.7 | - | 3.9 | 2.7 | ||||||||||||||||||||||||||||||||||
| Alcoholic beverages and tobacco | 28.0 | 130.9 | - | 0.9 | 1.6 | ||||||||||||||||||||||||||||||||||
| Clothing and footwear | 58.4 | 61.2 | 0.3 | -3.5 | -5.2 | ||||||||||||||||||||||||||||||||||
| Housing, water, electricity, fuels | 280.7 | 136.6 | -0.1 | -2.4 | -0.9 | ||||||||||||||||||||||||||||||||||
| Furnishings household equipment | 63.4 | 99.6 | -0.6 | 2.2 | 1.6 | ||||||||||||||||||||||||||||||||||
| Health | 29.1 | 138.7 | 0.9 | 2.7 | 2.4 | ||||||||||||||||||||||||||||||||||
| Transport | 180.0 | 127.4 | -0.5 | 0.6 | 1.5 | ||||||||||||||||||||||||||||||||||
| Communications | 25.4 | 81.1 | -1.1 | 1.6 | -1.5 | ||||||||||||||||||||||||||||||||||
| Recreation and culture | 121.9 | 107.9 | 0.1 | 1.0 | 0.9 | ||||||||||||||||||||||||||||||||||
| Education | 3.2 | 148.8 | - | 2.3 | 2.3 | ||||||||||||||||||||||||||||||||||
| Restaurants and hotels | 35.2 | 134.9 | 1.5 | 5.1 | 4.1 | ||||||||||||||||||||||||||||||||||
| Miscellaneous goods and services | 60.9 | 123.5 | 0.2 | 2.2 | 1.9 | ||||||||||||||||||||||||||||||||||
| CPI-AE | 115.1 | 0.1 | 2.0 | 1.5 | |||||||||||||||||||||||||||||||||||
| CPI-AT | 114.9 | -0.1 | 0.3 | 0.4 | |||||||||||||||||||||||||||||||||||
| CPI-ATE | 112.2 | 0.1 | 1.8 | 1.4 | |||||||||||||||||||||||||||||||||||
| CPI-ATE sesonal adjusted | 112.7 | 0.3 | |||||||||||||||||||||||||||||||||||||
Contact
-
Statistics Norway's Information Centre
E-mail: informasjon@ssb.no
tel.: (+47) 21 09 46 42
-
Konsumprisindeksen
E-mail: konsumprisindeksen@ssb.no
tel.: (+47) 62 88 56 34
-
Camilla Rochlenge
E-mail: camilla.rochlenge@ssb.no
tel.: (+47) 40 90 23 72
-
Kjersti Nyborg Hov
E-mail: kjersti.nyborg.hov@ssb.no
tel.: (+47) 40 90 23 63
-
Gunnar Larsson
E-mail: gunnar.larsson@ssb.no
tel.: (+47) 40 90 26 79
-
Trym Kristian Økland
E-mail: trym.okland@ssb.no
tel.: (+47) 46 81 09 15