Content
Published:
This is an archived release.
Summer sales behind fall in CPI
The consumer price index (CPI) fell by 0.3 per cent from June to July. The decrease is mainly attributable to the summer sales of clothing and footwear. In the last twelve months the CPI increased by 0.4 per cent, while the CPI adjusted for tax changes and excluding energy products (CPI-ATE) increased by 1.4 per cent.
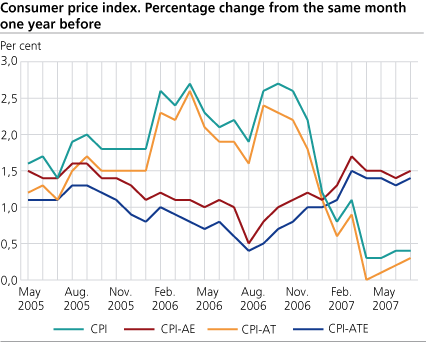
The CPI was 117.9 (1998=100) per July 2007 compared with 117.4 at the same time last year. This is equivalent to a growth of 0.4 per cent, unchanged from June. The year-to-year growth in the CPI-ATE was 1.4 per cent in July, up by 0.1 percentage points from June.
Price fall of clothing and footwear
Prices of clothing and footwear combined fell by 7.0 per cent, and were the most important reason for the CPI decrease from June to July. Although the summer sales take place every year, the fall in prices was stronger this year than in previous years. Accommodation services also had summer offers in July, which resulted in a price decrease of 7.1 per cent from June. A 1.1 per cent fall in prices of audiovisual equipment also contributed to the decrease in the CPI.
Food prices rose by 0.4 per cent from June to July, which can be seen in connection with the Norwegian agricultural settlement, which took effect from 1 July 2007. In particular, price increases of selected dairy products as well as egg, meat, fish and vegetables contributed to the increase in food prices. Non-alcoholic beverage prices went up by 2.6 per cent from June to July, mainly due to higher coffee prices.
With a price increase of 1.2 per cent, transport services contributed to dampen the decrease in the total CPI. Airline fares showed an increase of 1.5 per cent, which can be explained by higher security fees. Passenger transport by road and sea also increased. In addition, higher petrol prices and rents contributed to dampen the decrease in the total CPI.
Consumer prices up 0.4 per cent over last twelve months
The CPI increased by 0.4 per cent from July 2006 to July 2007. With a price increase of 6.5 per cent, goods and services connected to maintenance and repair of dwellings were among the most significant factors behind the CPI growth. Food and non-alcoholic beverage prices pushed in the same direction, increasing by 3.0 per cent from July last year to July this year.
Actual and imputed rentals for housing rose by 1.9 and 1.5 per cent respectively. Services related to recreation and culture, health, transport, and hotel and restaurants also contributed to the CPI increase.
Relatively few, but heavy components contributed to moderate the year-to-year growth in the CPI. Electricity had the greatest effect, with a price fall of 24 per cent from July last year to July this year. Clothing, telephone services and audiovisual equipments pulled in the same direction with significant price decreases.
The year-to-year growth in the CPI was 0.4 per cent in July, unchanged from June. The year-to-year growth in the CPI-ATE rose from 1.3 per cent in June to 1.4 per cent in July, while CPI adjusted for tax changes (CPI-AT) increased from 0.2 per cent in June to 0.3 per cent in July.
| The consumer price index. 1998 = 100 |
| Weights | Index | Change in per cent | |||||||||||||||||||||||||||||||||||||
|---|---|---|---|---|---|---|---|---|---|---|---|---|---|---|---|---|---|---|---|---|---|---|---|---|---|---|---|---|---|---|---|---|---|---|---|---|---|---|---|
| August 2006-July 2007 | July 2007 | June 2007-July 2007 | July 2006-July 2007 | Jan.-July 2006 - Jan.-July 2007 | |||||||||||||||||||||||||||||||||||
| CPI All-item index | 1 000.0 | 117.9 | -0.3 | 0.4 | 0.7 | ||||||||||||||||||||||||||||||||||
| Food and non-alcoholic beverages | 116.1 | 113.7 | 0.6 | 3.0 | 2.5 | ||||||||||||||||||||||||||||||||||
| Alcoholic beverages and tobacco | 29.9 | 130.9 | 0.1 | 1.1 | 1.7 | ||||||||||||||||||||||||||||||||||
| Clothing and footwear | 59.2 | 61.0 | -7.0 | -5.9 | -5.6 | ||||||||||||||||||||||||||||||||||
| Housing, water, electricity, fuels | 265.0 | 136.8 | 0.1 | -1.2 | -0.7 | ||||||||||||||||||||||||||||||||||
| Furnishings household equipment | 66.0 | 100.2 | -0.1 | 1.8 | 1.5 | ||||||||||||||||||||||||||||||||||
| Health | 29.5 | 137.5 | 0.6 | 2.7 | 2.2 | ||||||||||||||||||||||||||||||||||
| Transport | 176.0 | 128.1 | 0.4 | 1.2 | 1.6 | ||||||||||||||||||||||||||||||||||
| Communications | 27.6 | 82.0 | 1.0 | -2.0 | -2.0 | ||||||||||||||||||||||||||||||||||
| Recreation and culture | 124.0 | 107.8 | -0.2 | 0.6 | 0.9 | ||||||||||||||||||||||||||||||||||
| Education | 3.2 | 148.8 | - | 2.3 | 2.3 | ||||||||||||||||||||||||||||||||||
| Restaurants and hotels | 37.6 | 132.9 | -0.5 | 4.7 | 3.9 | ||||||||||||||||||||||||||||||||||
| Miscellaneous goods and services | 65.9 | 123.3 | 0.2 | 1.8 | 1.9 | ||||||||||||||||||||||||||||||||||
| CPI-AE | 115.0 | -0.3 | 1.5 | 1.4 | |||||||||||||||||||||||||||||||||||
| CPI-AT | 115.0 | -0.3 | 0.3 | 0.4 | |||||||||||||||||||||||||||||||||||
| CPI-ATE | 112.1 | -0.4 | 1.4 | 1.3 | |||||||||||||||||||||||||||||||||||
| CPI-ATE sesonal adjusted | 112.3 | 0.1 | |||||||||||||||||||||||||||||||||||||
Contact
-
Statistics Norway's Information Centre
E-mail: informasjon@ssb.no
tel.: (+47) 21 09 46 42
-
Konsumprisindeksen
E-mail: konsumprisindeksen@ssb.no
tel.: (+47) 62 88 56 34
-
Camilla Rochlenge
E-mail: camilla.rochlenge@ssb.no
tel.: (+47) 40 90 23 72
-
Kjersti Nyborg Hov
E-mail: kjersti.nyborg.hov@ssb.no
tel.: (+47) 40 90 23 63
-
Gunnar Larsson
E-mail: gunnar.larsson@ssb.no
tel.: (+47) 40 90 26 79
-
Trym Kristian Økland
E-mail: trym.okland@ssb.no
tel.: (+47) 46 81 09 15