Content
Published:
This is an archived release.
Decrease in Consumer Price Index
The Consumer Price Index (CPI) fell by 0.3 per cent from December 2005 to January 2006. The key factors behind the decrease were seasonal sales in clothing and furniture and the reduction in kindergarten fees. The CPI adjusted for tax changes and excluding energy products (CPI-ATE) increased by 0.8 per cent from January 2005 to January 2006, a decrease of 0.1 percentage point from December.
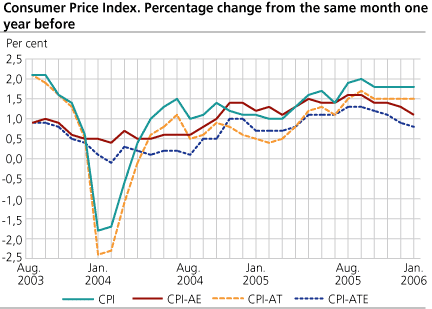
The CPI was 115.6 as of January 2006, compared to 113.6 in January 2005, an increase of 1.8 per cent in the last twelve months. The year-to-year growth remained unchanged since October last year.
CPI fell from December 2005 to January 2006
The Consumer price index fell by 0.3 per cent from December 2005 to January 2006. Seasonal discount sales in clothing and footwear were the most important factors behind the decline in the January index. The group showed a decrease of 8.9 per cent where prices of clothing fell by 9.6 per cent. Price decreases in furniture and household textiles were also registered.
In January 2006, a new rate for maximum kindergarten fees was enforced. Public kindergartens fell by 15.8 per cent while the private kindergartens showed a decrease in prices of 11.4 per cent1. Please see the kindergarten article " Household payments in kindergartens. Rates of change. January 2006 ". The contribution from the group social protection services to the decrease in the consumer prices was 0.14 percentage points, where kindergarten fees were major contributors.
Fuel prices increased by 3.6 per cent, while actual and imputed rentals for housing increased by 0.6 and 0.5 per cent respectively in the same period. An increase in prices was registered for food and non-alcoholic beverages, purchase of vehicles and higher fees for health services.
From January 2006 the value added tax on food and non-alcoholic beverages increased from 11 to 13 per cent and the lowest level of value added tax increased from 7 to 8 per cent. In addition there was an increase in some special taxes of about 1.8 per cent. The changes in taxes pulled the total CPI up by 0.4 percentage points.
Energy products pulled CPI up in the last 12 months
The CPI increased by 1.8 per cent from January 2005 to January 2006 and has remained at the same level since October 2005. The largest contribution to the year-to-year growth came from energy products where the petrol prices increased by 14.1 per cent while electricity prices rose by 6.7 per cent. CPI excluding energy products (CPI-AE) increased in the same period by 1.1 per cent - the energy products pulling up the CPI growth by 0.7 percentage points.
Actual and imputed rentals for housing increased by 2.4 and 2.3 per cent respectively from January 2005 to January 2006.
Several services also registered price increases. Health services showed a strong price increase of 8.4 per cent, followed by increased prices in services connected to recreation and culture, accommodations and transport services.
With a combined price decrease of 8.0 per cent, components under audio-visual equipments contributed mostly to weaken the CPI growth in the last 12 months. The significant price decrease in kindergarten fees in January helped in pulling the CPI down. The same downward effect was given by prices of clothing and footwear, falling 2.2 per cent since January last year.
Decrease in the year-to-year growth in CPI-ATE
The year-to-year growth in CPI remained unchanged at 1.8 per cent from December to January while the CPI-ATE fell by 0.1 percentage points and was 0.8 per cent in January 2006 compared to 0.9 per cent in December 2005. Kindergarten fees were the key factors that pulled down the year-to-year growth. The year-to-year growth in the CPI adjusted for tax changes (CPI-AT) remained unchanged at 1.5 per cent from December to January.
| The consumer price index. 1998=100 |
| Weights | Index | Change in per cent | |||||||||||||||||||||||||||||||||||||
|---|---|---|---|---|---|---|---|---|---|---|---|---|---|---|---|---|---|---|---|---|---|---|---|---|---|---|---|---|---|---|---|---|---|---|---|---|---|---|---|
| August 2005-July 2006 | January 2006 | December 2005-January 2006 | January 2005-January 2006 | ||||||||||||||||||||||||||||||||||||
| CPI All-item index | 1 000.0 | 115.6 | -0.3 | 1.8 | |||||||||||||||||||||||||||||||||||
| Food and non-alcoholic beverages | 117.4 | 108.2 | 0.7 | 1.5 | |||||||||||||||||||||||||||||||||||
| Alcoholic beverages and tobacco | 29.9 | 128.1 | 0.9 | 1.0 | |||||||||||||||||||||||||||||||||||
| Clothing and footwear | 59.2 | 66.5 | -8.9 | -2.2 | |||||||||||||||||||||||||||||||||||
| Housing, water, electricity, fuels | 260.2 | 135.0 | 0.4 | 3.0 | |||||||||||||||||||||||||||||||||||
| Furnishings household equipment | 69.6 | 97.3 | -2.7 | -0.6 | |||||||||||||||||||||||||||||||||||
| Health | 28.1 | 134.4 | 2.8 | 4.8 | |||||||||||||||||||||||||||||||||||
| Transport | 173.1 | 123.2 | 1.4 | 4.3 | |||||||||||||||||||||||||||||||||||
| Communications | 27.3 | 83.6 | 1.5 | 3.9 | |||||||||||||||||||||||||||||||||||
| Recreation and culture | 124.5 | 106.0 | -0.4 | -0.4 | |||||||||||||||||||||||||||||||||||
| Education | 3.2 | 145.5 | - | 2.2 | |||||||||||||||||||||||||||||||||||
| Restaurants and hotels | 38.6 | 126.8 | 1.1 | 2.4 | |||||||||||||||||||||||||||||||||||
| Miscellaneous goods and services | 68.9 | 119.9 | -2.0 | -1.2 | |||||||||||||||||||||||||||||||||||
| CPI-AE | 112.4 | -0.5 | 1.1 | ||||||||||||||||||||||||||||||||||||
| CPI-AT | 112.9 | -0.7 | 1.5 | ||||||||||||||||||||||||||||||||||||
| CPI-ATE | 109.7 | -0.8 | 0.8 | ||||||||||||||||||||||||||||||||||||
1The kindergarten survey, which is usually included in February, has been included in the January index.
Contact
-
Statistics Norway's Information Centre
E-mail: informasjon@ssb.no
tel.: (+47) 21 09 46 42
-
Konsumprisindeksen
E-mail: konsumprisindeksen@ssb.no
tel.: (+47) 62 88 56 34
-
Camilla Rochlenge
E-mail: camilla.rochlenge@ssb.no
tel.: (+47) 40 90 23 72
-
Kjersti Nyborg Hov
E-mail: kjersti.nyborg.hov@ssb.no
tel.: (+47) 40 90 23 63
-
Gunnar Larsson
E-mail: gunnar.larsson@ssb.no
tel.: (+47) 40 90 26 79
-
Trym Kristian Økland
E-mail: trym.okland@ssb.no
tel.: (+47) 46 81 09 15