Content
Published:
This is an archived release.
CPI up by 1.6 per cent in 2005
The Consumer Price Index (CPI) rose by 1.6 per cent from 2004 to 2005. The price increase in operation of personal transport equipment, higher prices of recreational and cultural services and the price rise in transport services, were key factors behind the growth. In the opposite direction, clothing and footwear, along with audiovisual equipment, contributed to dampen the CPI growth. The CPI adjusted for tax changes and excluding energy products (CPI-ATE) increased by 1.0 per cent from 2004 to 2005.
The yearly average CPI stood at 115.1 (1998=100) in 2005, compared to 113.3 in 2004, a yearly growth of 1.6 per cent (the annual growth is an average of the monthly indices in 2005 compared to the corresponding average for 2004).
The CPI was 115.9 as of December 2005, a decrease of 0.1 per cent from November. In December 2004 the CPI was 113.8, which meant an increase of 1.8 per cent in the last twelve months. The year-to-year growth in the CPI-ATE was 0.9 per cent in December, a decrease of 0.2 per cent points from November.
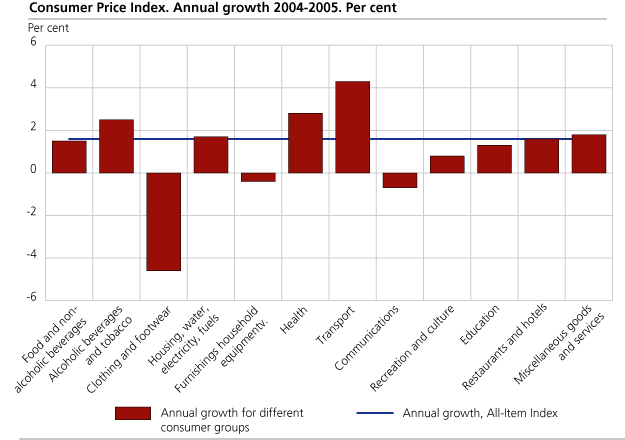
Yearly growth of 1.6 per cent in the Consumer Price Index
The price development in the components within the group operation of personal transport equipment was a key factor behind the increase in the CPI from 2004 to 2005. Petrol prices went up by 8.8 per cent, prices of accessories for personal transport equipment rose by 8.5 per cent, while prices related to maintenance and repair of personal transport equipment had a total increase of 4.8 per cent in the period. Transport services also contributed to the growth in the CPI from 2004 to 2005, with an average price increase of 5.4 per cent.
Actual and imputed rentals for housing increased by 2.3 and 2.1 per cent in 2005, respectively, while components in the group maintenance and repair of dwelling had an average price growth of 3.4 per cent.
In addition to the price rises connected to transport and housing, a number of different services showed price increases from 2004 to 2005. This was especially the case for services related to recreation and culture and health services that increased by 6.4 and 4.2 per cent, respectively.
The prices for clothing and footwear contributed to dampen the increase in CPI from 2004 to 2005.
The prices of clothing and footwear together fell by 4.6 per cent, whereof the clothing prices had the largest decline with an average price decrease of 4.9 per cent.
Prices in audiovisual equipments decreased significantly from 2004 to 2005. The prices in this group fell with a total of 7.9 per cent, which was a larger price decrease in comparison to the 6.7 per cent fall from 2003 to 2004.
Clothing and footwear pulled the CPI down from November to December
The Consumer Price Index decreased by 0.1 per cent from November to December 2005. The fall can mainly be attributed to clothing and footwear, which as a total went down by 1.1 per cent.
The price fall of telephone and audiovisual equipments also had a downward effect on the CPI. Prices of food and non-alcoholic beverages fell by 0.3 per cent and, especially fresh fruits had a significant price fall.
In the opposite direction, petrol and services connected to the maintenance and repair of dwelling was the most important components. Prices in these groups increased by 1.1 and 1.3 per cent, respectively from November to December 2005.
Fall in the year-to-year growth in CPI-ATE
The year-to-year growth in the CPI and CPI adjusted for tax changes (CPI-AT) was unchanged, while CPI-ATE fell by 0.2 per cent points from November to December 2005. The price development of energy products contributed to push the CPI and CPI-AT up in the last 12 months. Prices of food and non-alcoholic beverages contributed to dampen the year-to-year growth with a moderate price increase in December 2004 against a moderate price reduction in December 2005. These effects offset each other in CPI and CPI-AT, while CPI-ATE as mentioned experienced a fall of 0.2 percentage points.
Kindergarten survey results included in January
The kindergarten survey, which falls under the social protection group, will be included in the January index, which will be published 10 February 2006. This survey has earlier been included in the February index. This means that the effect of any changes in the kindergarten fees will have an effect a month earlier than the usual, which can affect the year-to-year rate of change.
| The Consumer Price Index. 1998 = 100 |
| Weights | Index | Change in per cent | |||||||||||||||||||||||||||||||||||||
|---|---|---|---|---|---|---|---|---|---|---|---|---|---|---|---|---|---|---|---|---|---|---|---|---|---|---|---|---|---|---|---|---|---|---|---|---|---|---|---|
| August 2005 - July 2006 | December 2005 | November 2005-December 2005 | December 2004- December 2005 | Yearly growth 2004 - 2005 | |||||||||||||||||||||||||||||||||||
| CPI All-item index | 1 000.0 | 115.9 | -0.1 | 1.8 | 1.6 | ||||||||||||||||||||||||||||||||||
| Food and non-alcoholic beverages | 117.4 | 107.5 | -0.3 | 0.9 | 1.5 | ||||||||||||||||||||||||||||||||||
| Alcoholic beverages and tobacco | 29.9 | 126.9 | - | 2.0 | 2.5 | ||||||||||||||||||||||||||||||||||
| Clothing and footwear | 59.2 | 73.0 | -1.1 | -3.8 | -4.6 | ||||||||||||||||||||||||||||||||||
| Housing, water, electricity, fuels | 260.2 | 134.4 | 0.1 | 2.8 | 1.7 | ||||||||||||||||||||||||||||||||||
| Furnishings household equipment | 69.6 | 100.0 | -0.3 | 0.4 | -0.4 | ||||||||||||||||||||||||||||||||||
| Health | 28.1 | 130.8 | -0.1 | 2.8 | 2.8 | ||||||||||||||||||||||||||||||||||
| Transport | 173.1 | 121.5 | 0.2 | 4.4 | 4.3 | ||||||||||||||||||||||||||||||||||
| Communications | 27.3 | 82.4 | -1.8 | 0.4 | -0.7 | ||||||||||||||||||||||||||||||||||
| Recreation and culture | 124.5 | 106.4 | - | 0.7 | 0.8 | ||||||||||||||||||||||||||||||||||
| Education | 3.2 | 145.5 | - | 2.2 | 1.3 | ||||||||||||||||||||||||||||||||||
| Restaurants and hotels | 38.6 | 125.4 | - | 2.0 | 1.6 | ||||||||||||||||||||||||||||||||||
| Miscellaneous goods and services | 68.9 | 122.4 | 0.2 | 1.7 | 1.8 | ||||||||||||||||||||||||||||||||||
| CPI-AE | 113.0 | -0.1 | 1.3 | 1.4 | |||||||||||||||||||||||||||||||||||
| CPI-AT | 113.7 | -0.1 | 1.5 | 1.2 | |||||||||||||||||||||||||||||||||||
| CPI-ATE | 110.6 | -0.2 | 0.9 | 1.0 | |||||||||||||||||||||||||||||||||||
Contact
-
Statistics Norway's Information Centre
E-mail: informasjon@ssb.no
tel.: (+47) 21 09 46 42
-
Konsumprisindeksen
E-mail: konsumprisindeksen@ssb.no
tel.: (+47) 62 88 56 34
-
Camilla Rochlenge
E-mail: camilla.rochlenge@ssb.no
tel.: (+47) 40 90 23 72
-
Kjersti Nyborg Hov
E-mail: kjersti.nyborg.hov@ssb.no
tel.: (+47) 40 90 23 63
-
Gunnar Larsson
E-mail: gunnar.larsson@ssb.no
tel.: (+47) 40 90 26 79
-
Trym Kristian Økland
E-mail: trym.okland@ssb.no
tel.: (+47) 46 81 09 15