Content
Published:
This is an archived release.
Price increase on electricity
The Consumer Price Index (CPI) increased by 0.2 per cent from July to August 2005. The increase in the CPI was mainly due to higher prices of electricity and clothing. From August 2004 to August 2005, the CPI increased by 1.9 per cent, while the CPI adjusted for tax changes and excluding energy products (CPI-ATE) rose by 1.3 per cent.
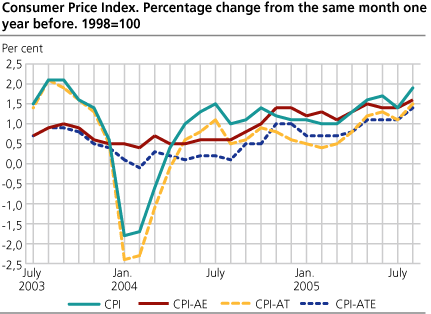
The CPI stood at 115.1 (1998=100) in August 2005 compared with 113.0 at the same time last year. The year-to-year growth in the CPI-ATE was 1.3 per cent in August, an increase from 1.1 per cent in July.
Higher prices on electricity and clothing
The CPI increased by 0.2 per cent from July to August. Prices of electricity increased by 3.2 per cent. Prices of clothing and footwear increased by 1.3 per cent in total. The prices of clothing had an upward effect on the CPI, while the prices of footwear fell and thus contributed to dampen the increase. Although the prices of clothing all together increased, the summer sales lasted into August.
Prices of social protection services increased slightly in August, mainly due to increased household payments in kindergartens. Public and private kindergarten fees have increased by 0.3 per cent in total since the last survey in January 2005. See Household payments in kindergartens for information on the development in kindergarten payments from January to August 2005. Prices of dental services also increased in August.
Prices of food fell by 0.8 per cent, mainly due to a drop in prices of fresh fruit and vegetables. As of August 2005, prices of food and non-alcoholic beverages will solely be based on bar code data. See Changes to the CPI for more information . Prices of products for the maintenance of dwellings and prices of audiovisual equipment also partly offset the increase in the CPI from July to August.
Petrol and transport services with upward effect on CPI in last 12 months
The CPI has increased by 1.9 per cent from August 2004 to August 2005. The main contributors to the year-to year growth came from the transport group, where prices of petrol and transport services have increased by 8.4 and 6.3 per cent respectively.
Actual and imputed rentals for housing have increased by 2.4 and 2.3 per cent respectively in the same period.
Services connected to recreation and culture also contributed to the growth in the CPI in the last 12 months with an increase of 6.4 per cent. Prices of dental and physical services also had an upward effect.
Prices of audiovisual equipment, clothing, footwear and furniture have had a downward effect on the CPI.
Increase in the year-to-year growth from July to August
The year-to-year growth in the CPI increased from 1.4 per cent in July to 1.9 per cent in August. The increase was mainly due to the price increase on clothing and electricity.
The year-to-year growth in the CPI-ATE increased from 1.1 per cent in July to 1.3 per cent in August, whereas the CPI adjusted for tax changes (CPI-AT) increased from 1.1 per cent in July to 1.5 per cent in August.
New weights in the CPI
For the period August 2005 to July 2006, the weights used in the CPI are based on average expenditure shares for 2002, 2003 and 2004. See: weights
| The Consumer Price Index. 1998=100 |
| Weights | Index | Change in per cent | |||||||||||||||||||||||||||||||||||||
|---|---|---|---|---|---|---|---|---|---|---|---|---|---|---|---|---|---|---|---|---|---|---|---|---|---|---|---|---|---|---|---|---|---|---|---|---|---|---|---|
|
August 2005-
July 2006 |
August 2005 |
July 2005-
August 2005 |
August 2004-
August 2005 |
January-August 2004-
January-August 2005 |
|||||||||||||||||||||||||||||||||||
| CPI All-item index | 1 000.0 | 115.1 | 0.2 | 1.9 | 1.3 | ||||||||||||||||||||||||||||||||||
| Food and non-alcoholic beverages | 117.4 | 108.4 | -0.7 | 1.9 | 1.5 | ||||||||||||||||||||||||||||||||||
| Alcoholic beverages and tobacco | 29.9 | 126.8 | 0.1 | 2.3 | 2.7 | ||||||||||||||||||||||||||||||||||
| Clothing and footwear | 59.2 | 68.4 | 1.3 | -1.3 | -5.2 | ||||||||||||||||||||||||||||||||||
| Housing, water, electricity, fuels | 260.2 | 132.4 | 0.5 | 1.8 | 1.3 | ||||||||||||||||||||||||||||||||||
| Furnishings household equipment | 69.6 | 99.5 | -0.1 | -0.2 | -0.8 | ||||||||||||||||||||||||||||||||||
| Health | 28.1 | 131.5 | 1.0 | 3.1 | 2.7 | ||||||||||||||||||||||||||||||||||
| Transport | 173.1 | 122.0 | 0.1 | 4.5 | 4.3 | ||||||||||||||||||||||||||||||||||
| Communications | 27.3 | 82.0 | -0.4 | 0.4 | -1.4 | ||||||||||||||||||||||||||||||||||
| Recreation and culture | 124.5 | 106.2 | -0.4 | 0.7 | 0.8 | ||||||||||||||||||||||||||||||||||
| Education | 3.2 | 142.3 | - | 0.9 | 0.9 | ||||||||||||||||||||||||||||||||||
| Restaurants and hotels | 38.6 | 123.9 | 0.6 | 1.5 | 1.6 | ||||||||||||||||||||||||||||||||||
| Miscellaneous goods and services | 68.9 | 122.2 | 0.1 | 2.0 | 1.8 | ||||||||||||||||||||||||||||||||||
| CPI-AE | 112.2 | - | 1.6 | 1.4 | |||||||||||||||||||||||||||||||||||
| CPI-AT | 112.8 | 0.2 | 1.5 | 1.0 | |||||||||||||||||||||||||||||||||||
| CPI-ATE | 109.8 | -0.1 | 1.3 | 0.9 | |||||||||||||||||||||||||||||||||||
Contact
-
Statistics Norway's Information Centre
E-mail: informasjon@ssb.no
tel.: (+47) 21 09 46 42
-
Konsumprisindeksen
E-mail: konsumprisindeksen@ssb.no
tel.: (+47) 62 88 56 34
-
Camilla Rochlenge
E-mail: camilla.rochlenge@ssb.no
tel.: (+47) 40 90 23 72
-
Kjersti Nyborg Hov
E-mail: kjersti.nyborg.hov@ssb.no
tel.: (+47) 40 90 23 63
-
Gunnar Larsson
E-mail: gunnar.larsson@ssb.no
tel.: (+47) 40 90 26 79
-
Trym Kristian Økland
E-mail: trym.okland@ssb.no
tel.: (+47) 46 81 09 15