Content
Published:
This is an archived release.
CPI rise driven by petrol prices
The Consumer Price Index (CPI) increased by 0.5 per cent from March to April 2005, mainly due to price increases of petrol and clothing. The CPI has increased by 1.3 per cent in the last 12 months, while the CPI adjusted for tax changes and excluding energy products (CPI-ATE) has risen by 0.8 per cent.
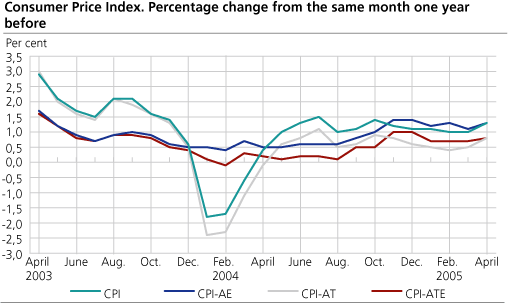
The CPI stood at 114.8 (1998=100) in April 2005 compared with 113.3 at the same time last year, an increase of 1.3 per cent. The year-to-year growth in the CPI-ATE was 0.8 per cent in April, up from 0.7 per cent in March.
Higher prices of petrol
The CPI increased by 0.5 per cent from March to April this year, mainly driven by price increases connected to transport. With a 5.7 per cent price increase, petrol was the largest single contributor to the CPI growth. If we include last month's increase, the price of petrol has increased by 9.5 per cent since January this year. Another upward effect came from airline fares, which increased by 2.7 per cent due to increased fuel costs and service fees.
The prices of clothing also had an upward effect on the CPI from March to April. The 1.9 per cent price increase of clothing was however far more moderate than last month's increase. The same applies to footwear prices, which increased by 1.0 per cent from March to April.
Rentals increased by 0.5 per cent from March to April and also contributed to the CPI growth.
Certain products and services connected to recreation and culture, particularly boats and boating equipment and sports and leisure services, also resulted in upward pressure on the CPI.
Transport pushed CPI up
The CPI has increased by 1.3 per cent from April 2004 to April 2005. The main contributor to the year-to-year growth in April was the transport group, with price increases of petrol and transport services of 10.6 and 5.9 per cent respectively. In particular, prices of passenger transport by air and sea have increased substantially during the last 12 months.
Rentals for housing and costs for owner-occupied housing have increased by 2.3 and 2.1 per cent respectively from April 2004 to April 2005. Materials for maintenance and repair of dwellings have also had an upward effect on the CPI, with a price rise of 5.7 per cent in the last 12 months.
Prices of services connected to recreation and culture have risen by 5.9 per cent in the last 12 months.
The prices of clothing had a downward effect on the CPI, falling by 6.4 per cent from April 2004 to April 2005. With a 5.6 per cent fall in the last 12 months, the electricity prices have also contributed to offset the CPI increase. The same applies to audiovisual equipment, which has experienced a 7.2 per cent fall in prices.
Increased year-to-year growth
The year-to-year change in the CPI rose from 1.0 per cent in March to 1.3 per cent in April. The increase is to a large extent attributable to the price development of petrol. The petrol prices rose by 5.7 per cent in April this year, compared to a marginal increase in April last year. Airline fares and rentals contributed in the same direction.
| The Consumer Price Index. 1998=100 |
| Weights | Index | Change in per cent | |||||||||||||||||||||||||||||||||||||
|---|---|---|---|---|---|---|---|---|---|---|---|---|---|---|---|---|---|---|---|---|---|---|---|---|---|---|---|---|---|---|---|---|---|---|---|---|---|---|---|
|
August 2004-
July 2005 |
April 2005 |
March-
April 2005 |
April 2004-
April 2005 |
January-April 2004-
January-April 2005 |
|||||||||||||||||||||||||||||||||||
| CPI All-item index | 1 000.0 | 114.8 | 0.5 | 1.3 | 1.1 | ||||||||||||||||||||||||||||||||||
| Food and non-alcoholic beverages | 116.0 | 108.0 | 0.2 | 1.2 | 1.2 | ||||||||||||||||||||||||||||||||||
| Alcoholic beverages and tobacco | 29.4 | 126.4 | -0.1 | 2.9 | 2.9 | ||||||||||||||||||||||||||||||||||
| Clothing and footwear | 59.8 | 71.5 | 1.7 | -5.9 | -5.6 | ||||||||||||||||||||||||||||||||||
| Housing, water, electricity, fuels | 258.0 | 130.8 | 0.4 | 1.4 | 0.8 | ||||||||||||||||||||||||||||||||||
| Furnishings and household equipment | 71.8 | 100.3 | -0.2 | -1.1 | -1.3 | ||||||||||||||||||||||||||||||||||
| Health | 27.7 | 128.8 | 0.2 | 2.8 | 2.6 | ||||||||||||||||||||||||||||||||||
| Transport | 175.2 | 120.7 | 1.3 | 4.9 | 4.3 | ||||||||||||||||||||||||||||||||||
| Communications | 24.9 | 80.8 | 0.1 | -3.0 | -3.5 | ||||||||||||||||||||||||||||||||||
| Recreation and culture | 126.6 | 106.8 | 0.4 | 0.7 | 0.9 | ||||||||||||||||||||||||||||||||||
| Education | 3.2 | 142.3 | - | 0.9 | 0.9 | ||||||||||||||||||||||||||||||||||
| Restaurants and hotels | 38.5 | 124.2 | - | 1.9 | 1.8 | ||||||||||||||||||||||||||||||||||
| Miscellaneous goods and services | 68.9 | 122.1 | - | 1.8 | 1.7 | ||||||||||||||||||||||||||||||||||
| CPI-AE | 112.4 | 0.4 | 1.3 | 1.2 | |||||||||||||||||||||||||||||||||||
| CPI-AT | 112.4 | 0.5 | 0.8 | 0.5 | |||||||||||||||||||||||||||||||||||
| CPI-ATE | 110.0 | 0.4 | 0.8 | 0.7 | |||||||||||||||||||||||||||||||||||
Contact
-
Statistics Norway's Information Centre
E-mail: informasjon@ssb.no
tel.: (+47) 21 09 46 42
-
Konsumprisindeksen
E-mail: konsumprisindeksen@ssb.no
tel.: (+47) 62 88 56 34
-
Camilla Rochlenge
E-mail: camilla.rochlenge@ssb.no
tel.: (+47) 40 90 23 72
-
Kjersti Nyborg Hov
E-mail: kjersti.nyborg.hov@ssb.no
tel.: (+47) 40 90 23 63
-
Gunnar Larsson
E-mail: gunnar.larsson@ssb.no
tel.: (+47) 40 90 26 79
-
Trym Kristian Økland
E-mail: trym.okland@ssb.no
tel.: (+47) 46 81 09 15