Content
Published:
This is an archived release.
Lower prices of clothing and footwear
The Consumer Price Index (CPI) fell by 0.1 per cent from June to July, mainly due to summer sales of clothing and footwear. The prices of energy products counteracted the price fall. The consumer prices have increased by 1.5 per cent over the last 12 months, up from 1.3 per cent in June.
The CPI stood at 113.3 (1998=100) in July this year compared with 111.6 in July last year, an increase of 1.5 per cent. The CPI adjusted for tax changes and excluding energy products (CPI-ATE) has risen by 0.2 per cent in the same period.
Summer sales of clothing and footwear
The consumer prices fell by 0.1 per cent from June to July, mainly due to summer sales of clothing and footwear. The prices of clothing and footwear fell by 4.4 per cent in total. Another downward effect came from furniture, although the decrease here was more moderate. Accommodation services also showed a seasonal fall in prices of 5.1 per cent from June to July.
Costs for owner-occupied housing and rentals for housing both fell slightly, at 0.2 per cent from June to July.
The prices of energy products contributed to dampen the CPI fall in July, as petrol prices increased by 2.0 per cent while electricity tariffs as a total climbed by 1.1 per cent.
Another upward effect came from increased prices of medical services and a slight rise in insurance premiums.
Year-to-year change: Price increase of 1.5 per cent
The consumer prices have increased by 1.5 per cent from July 2003 to July 2004. Energy products are the main driving force behind the rising prices, as electricity tariffs have increased by 14.7 per cent and petrol prices by 10.4 per cent. As a result, the CPI excluding energy products (CPI-AE) has risen by 0.6 per cent.
With a staggering 19.5 per cent increase, the tobacco prices have also contributed to the growth in the CPI. The same applies to health services, which have shown a 9.1 per cent price rise.
The prices of clothing have counteracted the year-to-year increase as the prices have dropped by 6.6 per cent. Several other components have also dampened the CPI growth, such as airline fares, the prices of audiovisual equipment and social protection services.
Further increase in the year-to-year change
The year-to-year growth in the CPI increased from 1.3 per cent in June to 1.5 per cent in July. The rise is mainly due to the price developments of electricity tariffs and clothing. The electricity tariffs increased by 1.1 per cent in July this year, compared with a drop of 5.3 per cent in July last year. The clothing prices fell by 4.4 per cent in July this year compared with 6.0 per cent in the same period last year.
The price developments of food and rentals counteracted the increase in the year-to-year growth.
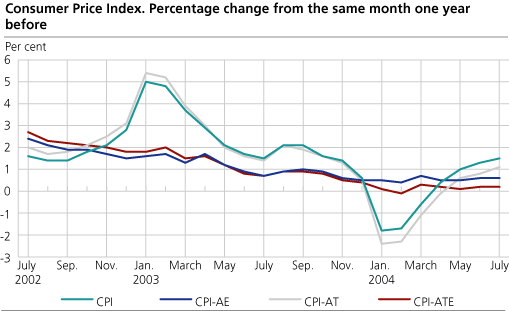
The year-to-year growth in the CPI adjusted for tax changes (CPI-AT) climbed from 0.8 per cent in June to 1.1 per cent in July. The growth in the CPI-ATE in July stayed unchanged from June at a 0.2 per cent increase.
| The Consumer Price Index. 1998 = 100 |
| Index | Change in per cent | ||||||||||||||||||||||||||||||||||||||
|---|---|---|---|---|---|---|---|---|---|---|---|---|---|---|---|---|---|---|---|---|---|---|---|---|---|---|---|---|---|---|---|---|---|---|---|---|---|---|---|
| July 2004 |
June 2004-
July 2004 |
July 2003-
July 2004 |
January-July 2003-
January-July 2004 |
||||||||||||||||||||||||||||||||||||
| CPI All-item index | 113.3 | -0.1 | 1.5 | - | |||||||||||||||||||||||||||||||||||
| Food and non-alcoholic beverages | 107.1 | 0.1 | 1.4 | 2.5 | |||||||||||||||||||||||||||||||||||
| Alcoholic beverages and tobacco | 123.8 | 0.1 | 7.6 | 7.3 | |||||||||||||||||||||||||||||||||||
| Clothing and footwear | 71.9 | -4.4 | -6.3 | -8.7 | |||||||||||||||||||||||||||||||||||
| Housing, water, electricity, fuels | 129.8 | 0.2 | 4.0 | -0.7 | |||||||||||||||||||||||||||||||||||
| Furnishings household equipment | 100.1 | -0.4 | -1.9 | -1.4 | |||||||||||||||||||||||||||||||||||
| Health | 126.4 | 0.6 | 4.9 | 4.8 | |||||||||||||||||||||||||||||||||||
| Transport | 116.7 | 0.6 | 2.4 | 0.8 | |||||||||||||||||||||||||||||||||||
| Communications | 81.7 | -0.4 | -4.3 | -4.6 | |||||||||||||||||||||||||||||||||||
| Recreation and culture | 105.8 | - | 0.4 | -0.5 | |||||||||||||||||||||||||||||||||||
| Education | 141.1 | - | 6.9 | 6.9 | |||||||||||||||||||||||||||||||||||
| Restaurants and hotels | 121.6 | -0.5 | 1.9 | 2.4 | |||||||||||||||||||||||||||||||||||
| Miscellaneous goods and services | 119.9 | 0.3 | 0.1 | 0.9 | |||||||||||||||||||||||||||||||||||
| CPI-AE | 110.7 | -0.3 | 0.6 | 0.5 | |||||||||||||||||||||||||||||||||||
| CPI-AT | -0.1 | 1.1 | -0.5 | ||||||||||||||||||||||||||||||||||||
| CPI-ATE | -0.2 | 0.2 | 0.2 | ||||||||||||||||||||||||||||||||||||
Contact
-
Statistics Norway's Information Centre
E-mail: informasjon@ssb.no
tel.: (+47) 21 09 46 42
-
Konsumprisindeksen
E-mail: konsumprisindeksen@ssb.no
tel.: (+47) 62 88 56 34
-
Camilla Rochlenge
E-mail: camilla.rochlenge@ssb.no
tel.: (+47) 40 90 23 72
-
Kjersti Nyborg Hov
E-mail: kjersti.nyborg.hov@ssb.no
tel.: (+47) 40 90 23 63
-
Gunnar Larsson
E-mail: gunnar.larsson@ssb.no
tel.: (+47) 40 90 26 79
-
Trym Kristian Økland
E-mail: trym.okland@ssb.no
tel.: (+47) 46 81 09 15