Content
Published:
This is an archived release.
Electricity tariffs cause fall in CPI
The Consumer Price Index (CPI) declined by 1.8 per cent from January 2003 to January 2004, mainly due to the price development of electricity tariffs. CPI adjusted for tax changes and excluding energy products (CPI-ATE) increased by 0.1 per cent the last 12 months.
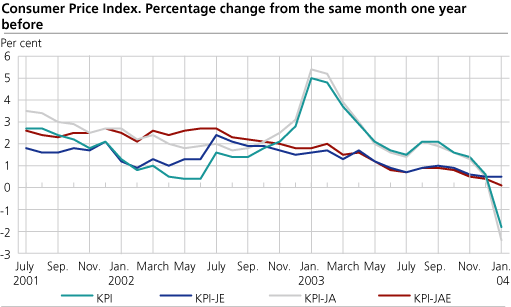
The year-to-year change in the CPI fell substantially from December to January. The decline is a result of the price development of electricity tariffs. In January last year the electricity tariffs showed an extreme rise, while they decreased slightly in January this year. The year-to-year growth in CPI excluding electricity was 0.5 per cent in January, unchanged from December.
CPI stood at 112.4 (1998=100) in January this year in comparison with 114.5 in January last year, a decrease of 1.8 per cent. The year-to-year growth in December was 0.6 per cent.
January sales on clothing
The CPI fell by 0.2 per cent from December to January, mainly caused by January sales on clothing and footwear. Prices of clothing fell by 10.1 per cent, which is stronger than the price decrease of footwear. Prices of furniture and household textiles also had a downward effect on CPI in January.
In total, tariffs on electricity fell by 1.0 per cent. As of 1 January 2004 the consumption tax is collected by the companies that transport the electricity and not by the suppliers of electricity. This change resulted in a strong fall in electricity prices and a strong increase in the cost of electricity transport. The consumption tax was adjusted for expected inflation in January and increased from NOK 9.5 to 9.67 øre/kWh.
Prices of tobacco increased by a substantial 17.6 per cent, mainly due to tax increases, while the prices of alcoholic beverages increased by 1.8 per cent. Adjusted for tax changes, prices of alcoholic beverages and tobacco increased by 0.2 per cent from December to January.
Prices of some health services also increased from December to January. Prices of dental services went up 2.5 per cent since the last survey in August 2003. Prices of medical and paramedical services increased as well.
As of 1 January most taxes were adjusted for expected inflation of about 1.8 per cent. CPI adjusted for tax changes (CPI-AT) fell by 0.6 per cent from December to January, 0.4 percentage points more than CPI. As of CPI for January, tax adjusted prices of motor cars are included in the CPI-AT.
Decrease of 1.8 per cent in the last 12 months
The consumer prices fell by 1.8 per cent from January 2003 to January 2004. This is the strongest price fall to be recorded since December 1947. Due to the strong increase in electricity prices in January last year, the tariffs are 30.8 per cent lower than last year's price level, making electricity tariffs the largest contributor to the overall fall in CPI.
For a number of years prices of clothing have shown a falling trend and in January the prices were 12.3 per cent lower than in January 2003. Airline fares have fallen by 17.8 per cent in the same period and the prices of audiovisual equipment have declined by 8.0 per cent. Other contributions come from lower prices of telephone equipment and package holidays.
Food prices have increased by 3.0 per cent while the rentals for housing and the cost for owner-occupied housing have gone up 2.6 and 2.5 per cent respectively. The strong price increase on tobacco in January, along with higher prices for a number of services, partly offset the fall in the CPI from January 2003 to January 2004.
Strong price fall in the year-to-year change
As mentioned above, the development of electricity tariffs is the largest downward contributor to the fall in the year-to-year change of 2.4 percentage points. Electricity tariffs increased by 48.6 per cent in January last year in comparison with a slight decline in January this year. Rentals remained flat from December to January while the cost of owner-occupied housing and rentals for housing went up 1.3 and 1.2 per cent respectively in the same period last year. The price development of transport services, food and insurance expenditures also explain the fall in the year-to-year change.
The year-to-year change in the CPI-AT fell from an increase of 0.5 per cent in December to a decrease of 2.4 per cent in January. The CPI-ATE went down from 0.4 per cent to 0.1 per cent in the same period, the lowest growth rate registered since it was first published for August 2000.
As of 10 February the CPI-AT is published on the 12 division levels (COICOP) and by delivery sectors back to January 2003, see table 12 and 13 .
| The Consumer Price Index. 1998=100 |
| Index. January 2004 | Change in per cent | ||||||||||||||||||||||||||||||||||||||
|---|---|---|---|---|---|---|---|---|---|---|---|---|---|---|---|---|---|---|---|---|---|---|---|---|---|---|---|---|---|---|---|---|---|---|---|---|---|---|---|
| Dec. 2003-Jan. 2004 | Jan. 2003-Jan. 2004 | Annual growth 2002-2003 | |||||||||||||||||||||||||||||||||||||
| CPI All-item index | 112.4 | -0.2 | -1.8 | 2.5 | |||||||||||||||||||||||||||||||||||
| Food and non-alcoholic beverages | 105.4 | 0.2 | 2.9 | 3.4 | |||||||||||||||||||||||||||||||||||
| Alcoholic beverages and tobacco | 122.6 | 8.7 | 7.2 | 1.1 | |||||||||||||||||||||||||||||||||||
| Clothing and footwear | 70.8 | -9.9 | -11.5 | -10.6 | |||||||||||||||||||||||||||||||||||
| Housing, water, electricity, fuels | 130.4 | -0.1 | -5.9 | 8.7 | |||||||||||||||||||||||||||||||||||
| Furnishings household equipment | 100.1 | -1.8 | -0.9 | -0.8 | |||||||||||||||||||||||||||||||||||
| Health | 125.1 | 2.0 | 5.6 | 3.9 | |||||||||||||||||||||||||||||||||||
| Transport | 113.0 | 0.6 | -1.0 | 1.1 | |||||||||||||||||||||||||||||||||||
| Communications | 84.0 | - | -4.8 | -2.9 | |||||||||||||||||||||||||||||||||||
| Recreation and culture | 105.4 | 0.9 | -0.8 | -0.2 | |||||||||||||||||||||||||||||||||||
| Education | 141.1 | - | 6.9 | 5.8 | |||||||||||||||||||||||||||||||||||
| Restaurants and hotels | 121.6 | 0.6 | 3.0 | 3.0 | |||||||||||||||||||||||||||||||||||
| Miscellaneous goods and services | 120.1 | 0.6 | 2.0 | 3.5 | |||||||||||||||||||||||||||||||||||
| CPI-AE | 109.9 | -0.1 | 0.5 | 1.0 | |||||||||||||||||||||||||||||||||||
| CPI-AT | -0.6 | -2.4 | 2.5 | ||||||||||||||||||||||||||||||||||||
| CPI-ATE | -0.4 | 0.1 | 1.1 | ||||||||||||||||||||||||||||||||||||
Contact
-
Statistics Norway's Information Centre
E-mail: informasjon@ssb.no
tel.: (+47) 21 09 46 42
-
Konsumprisindeksen
E-mail: konsumprisindeksen@ssb.no
tel.: (+47) 62 88 56 34
-
Camilla Rochlenge
E-mail: camilla.rochlenge@ssb.no
tel.: (+47) 40 90 23 72
-
Kjersti Nyborg Hov
E-mail: kjersti.nyborg.hov@ssb.no
tel.: (+47) 40 90 23 63
-
Gunnar Larsson
E-mail: gunnar.larsson@ssb.no
tel.: (+47) 40 90 26 79
-
Trym Kristian Økland
E-mail: trym.okland@ssb.no
tel.: (+47) 46 81 09 15