Content
Published:
This is an archived release.
Electricity prices increased considerably
The Consumer Price Index (CPI) rose 0.3 per cent from July to August. The increase was mainly due to an increase in tariffs on electricity. The year-to-year change in the CPI was 2.1 per cent in August, while the CPI adjusted for tax changes and excluding energy products (CPI-ATE) was 0.9 per cent.
The CPI stood at 111.9 (1998=100) in August this year in comparison with 109.6 in August last year. The year-to-year change in the CPI increased from 1.5 per cent in July to 2.1 per cent in August mainly as a result of the price development of electricity.
Consumer prices up 0.3 per cent from July to August
The consumer prices rose 0.3 per cent from July to August mainly due to an increase in the tariffs on electricity. In contrast to decreasing electricity prices every month since February this year - the tariffs on electricity showed an increase of 11.9 per cent from July to August. This is a large increase compared with the same period in previous years. The electricity prices rose substantially, while the cost connected to transporting energy increased only marginally. The petrol prices went up 1.8 per cent from July to August. The CPI excluding energy products (CPI-AE) declined by 0.3 per cent.
A price increase of services such as dental services and accommodation services contributed to the growth in the consumer prices as well.
The prices of social services as a total went down 4.4 per cent and contributed to moderate the increase in the CPI from July to August. Households` payments in both public and private kindergartens fell since the last survey. For more information about the kindergarten payments, see the article: Households` payments in kindergartens, August 2003 . The price decrease of social services was counteracted by an increase in the prices of after- school activities.
The sales activity on clothing and footwear carried on in August, but declined compared with July. As a total the prices of clothing and footwear declined by 1.7 per cent. The prices of footwear fell somewhat more than the prices of clothing. A seasonal price decrease on fresh vegetables was also registered. The prices of food went down by 0.8 per cent.
The prices of audiovisual equipment showed a decrease as well.
Year-to-year change: Tariffs on electricity contribute to price growth
The CPI has increased by 2.1 per cent from August 2002 to August 2003. Tariffs on electricity are the largest single contributor to the year-to-year growth in the consumer prices. The tariffs were 34.2 per cent higher in August compared with the same period last year. The CPI excluding electricity has risen by 1.1 per cent from August last year. The tariffs on electricity therefore increase the consumer price growth by 1.0 percentage points.
Rentals have also contributed to the increase in the CPI during the last 12 months. Rentals for housing and the cost for owner-occupied housing have gone up by 3.9 and 3.8 per cent respectively from August 2002 to August 2003. The prices of food have increased by 3.3 per cent, of which particularly the prices of flour, grain, bread, some dairy products, fruit and vegetables have gone up.
Other contributing factors to the CPI growth have been services connected to insurance, health and transport - which have increased by 9.3, 5.8 and 4.5 per cent respectively since August last year. The same applies to the petrol prices that have gone up by 3.9 per cent.
The prices of clothing were 11.6 per cent lower in August this year compared with the same period last year. The prices of footwear have dampened the increase in the consumer prices as well. Audiovisual equipment has shown a price decrease of 9.6 per cent from August last year. Reductions in the payments in both public and private kindergartens during the last 12 months have also moderated the CPI growth.
The CPI-ATE and the CPI-AE have both increased by 0.9 per cent from August 2002 to August 2003. Energy products therefore pull the consumer price growth up by 1.2 percentage points.
Increase in the year-to-year growth
The year-to-year growth in the CPI went from 1.5 per cent in July to 2.1 per cent in August. The increase is mainly due to a rise in the tariffs on electricity from July to August as the prices went up 11.9 per cent, as opposed to August last year when the tariffs went up only slightly.
The development in the prices of clothing, footwear, rentals, furniture and household textiles also explains the growth in the year-to-year change.
A stronger decline in the kindergarten fees in August this year compared with August last year contributed to moderate the rise in the year-to-year change. The price development of accommodation services counteracted the increase in the year-to-year growth as well.
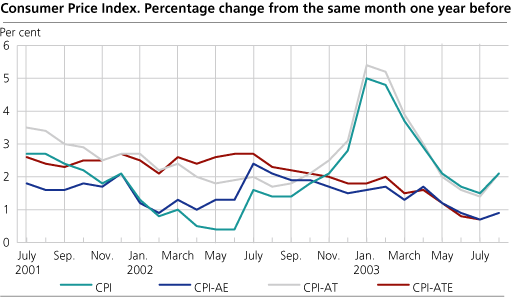
The CPI adjusted for tax changes (CPI-AT) increased from 1.4 per cent in July to 2.1 per cent in August. The CPI-ATE went from 0.7 per cent to 0.9 per cent in the same period.
New weights in the CPI
For the period August 2003 to July 2004 the weights in the CPI are based on average expenditure shares of 2000, 2001 and 2002. See: weights .
New method for cars
As of August 2003 a new method for calculating the car index is being used. For more information see: About the statistics .
| The Consumer Price Index. 1998=100 |
| Index | Change in per cent | ||||||||||||||||||||||||||||||||||||||
|---|---|---|---|---|---|---|---|---|---|---|---|---|---|---|---|---|---|---|---|---|---|---|---|---|---|---|---|---|---|---|---|---|---|---|---|---|---|---|---|
| August 2003 | July 2003-August 2003 | August 2002-August 2003 | January-August 2002 - January-August 2003 | ||||||||||||||||||||||||||||||||||||
| CPI All-item index | 111.9 | 0.3 | 2.1 | 3.0 | |||||||||||||||||||||||||||||||||||
| Food and non-alcoholic beverages | 105.0 | -0.6 | 3.2 | 3.3 | |||||||||||||||||||||||||||||||||||
| Alcoholic beverages and tobacco | 115.1 | - | 1.3 | 1.5 | |||||||||||||||||||||||||||||||||||
| Clothing and footwear | 75.4 | -1.7 | -10.7 | -10.1 | |||||||||||||||||||||||||||||||||||
| Housing, water, electricity, fuels | 127.0 | 1.8 | 7.5 | 10.2 | |||||||||||||||||||||||||||||||||||
| Furnishings household equipment | 101.9 | -0.1 | -0.6 | -0.8 | |||||||||||||||||||||||||||||||||||
| Health | 121.7 | 1.0 | 3.5 | 3.8 | |||||||||||||||||||||||||||||||||||
| Transport | 114.4 | 0.4 | 1.5 | 1.5 | |||||||||||||||||||||||||||||||||||
| Communications | 85.9 | 0.6 | -3.9 | -1.8 | |||||||||||||||||||||||||||||||||||
| Recreation and culture | 104.8 | -0.6 | -1.0 | 0.2 | |||||||||||||||||||||||||||||||||||
| Education | 132.0 | - | 5.1 | 5.1 | |||||||||||||||||||||||||||||||||||
| Restaurants and hotels | 119.7 | 0.3 | 2.7 | 3.2 | |||||||||||||||||||||||||||||||||||
| Miscellaneous goods and services | 118.7 | -0.9 | 3.5 | 3.7 | |||||||||||||||||||||||||||||||||||
| CPI-AE | 109.7 | -0.3 | 0.9 | 1.2 | |||||||||||||||||||||||||||||||||||
| CPI-AT | 0.3 | 2.1 | 3.1 | ||||||||||||||||||||||||||||||||||||
| CPI-ATE | -0.2 | 0.9 | 1.3 | ||||||||||||||||||||||||||||||||||||
Contact
-
Statistics Norway's Information Centre
E-mail: informasjon@ssb.no
tel.: (+47) 21 09 46 42
-
Konsumprisindeksen
E-mail: konsumprisindeksen@ssb.no
tel.: (+47) 62 88 56 34
-
Camilla Rochlenge
E-mail: camilla.rochlenge@ssb.no
tel.: (+47) 40 90 23 72
-
Kjersti Nyborg Hov
E-mail: kjersti.nyborg.hov@ssb.no
tel.: (+47) 40 90 23 63
-
Gunnar Larsson
E-mail: gunnar.larsson@ssb.no
tel.: (+47) 40 90 26 79
-
Trym Kristian Økland
E-mail: trym.okland@ssb.no
tel.: (+47) 46 81 09 15