Content
Published:
This is an archived release.
Consumer price index up 3.5 per cent
The Consumer Price Index (CPI) went down 0.1 per cent from July to August 2000. This was mainly caused by a decrease in the prices of petrol and in clothing and footwear sales. The year-to-year growth in August was 3.5 per cent per cent. In July it was 3.3 per cent.
In August the CPI was 105.3 (1998=100). In August 1999 it was 101.7.
Price change from July to August
The prices of petrol went down by 3.6 per cent last month. The price of 95-octane petrol decreased more than 98-octane.
Prices of clothes and footwear kept decreasing due to summer sales. The prices of clothing and footwear dropped by 2.0 per cent from July to August. The prices of footwear decreased the most.
The prices of food went down by 0.7 per cent, mainly because of seasonal lower prices of fruit and vegetables.
Rentals for housing increased by 0.7 per cent from July to August.
The prices for kindergartens increased by 1.6 per cent from the last survey in February. The dental services rose by 3.1 per cent in the same period.
Year-to-year change
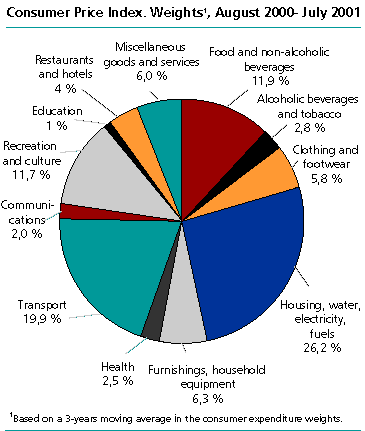
The last 12 months the CPI has increased by 3.5 per cent. The main contributor to the growth in August is increased housing expenses. A sharp rise in the price of energy products such as fuels, heating oil and paraffin over the last 12 months, due to higher oil prices, explains most of the overall change in the CPI. Higher rentals for housing the last 12 months also contribute to the increase in the year-to-year change.
Another contributor to the growth rate is found in the transport sector. The prices of petrol have increased by 11, 0 per cent since August last year. The increase is mainly due to increased prices of crude oil. There has been a strong price increase in some services within the transport sector as well. The prices of airline tickets have risen by 16 per cent, and the prices of passenger transport by road have increased by 9.2 per cent mainly due to the deregulation of the taxi market.
The prices of alcoholic beverages and tobacco have increased by 7.4 per cent the last year. This rise is mainly caused by commodity taxes. The taxes on tobacco have increased more than the taxes on alcohol, which is reflected in the price increases.
Prices for clothing, telephone services and audio-visual equipment have been falling for several years and dampened the increase in the year-to-year change.
| The Consumer Price Index. 1998 = 100 |
|
Index
August 2000 |
Change in per cent | ||||||||||||||||||||||||||||||||||||||
|---|---|---|---|---|---|---|---|---|---|---|---|---|---|---|---|---|---|---|---|---|---|---|---|---|---|---|---|---|---|---|---|---|---|---|---|---|---|---|---|
|
July 2000-
August 2000 |
August 1999-
August 2000 |
January-August 1999-
January-August 2000 |
|||||||||||||||||||||||||||||||||||||
| All-item index | 105,3 | -0,1 | 3,5 | 3,0 | |||||||||||||||||||||||||||||||||||
| Food and non-alcoholic beverages | 105,3 | -0,4 | 2,3 | 1,8 | |||||||||||||||||||||||||||||||||||
| Alcoholic beverages and tobacco | 110,7 | - | 7,4 | 6,9 | |||||||||||||||||||||||||||||||||||
| Clothing and footwear | 91,0 | -2,0 | -2,4 | -4,4 | |||||||||||||||||||||||||||||||||||
| Housing, water, electricity, fuels | 106,4 | 0,7 | 5,6 | 4,6 | |||||||||||||||||||||||||||||||||||
| Furnishings household equipment | 101,6 | -0,4 | 0,5 | 0,7 | |||||||||||||||||||||||||||||||||||
| Health | 108,9 | 1,0 | 3,3 | 3,4 | |||||||||||||||||||||||||||||||||||
| Transport | 108,9 | -0,6 | 5,4 | 5,4 | |||||||||||||||||||||||||||||||||||
| Communications | 89,9 | 0,1 | -0,8 | -4,8 | |||||||||||||||||||||||||||||||||||
| Recreation and culture | 104,1 | -0,1 | 1,5 | 1,5 | |||||||||||||||||||||||||||||||||||
| Education | 108,5 | - | 5,3 | 5,3 | |||||||||||||||||||||||||||||||||||
| Restaurants and hotels | 107,4 | 0,8 | 4,4 | 3,0 | |||||||||||||||||||||||||||||||||||
| Miscellaneous goods and services | 107,3 | 0,4 | 3,0 | 2,5 | |||||||||||||||||||||||||||||||||||
Contact
-
Statistics Norway's Information Centre
E-mail: informasjon@ssb.no
tel.: (+47) 21 09 46 42
-
Konsumprisindeksen
E-mail: konsumprisindeksen@ssb.no
tel.: (+47) 62 88 56 34
-
Camilla Rochlenge
E-mail: camilla.rochlenge@ssb.no
tel.: (+47) 40 90 23 72
-
Kjersti Nyborg Hov
E-mail: kjersti.nyborg.hov@ssb.no
tel.: (+47) 40 90 23 63
-
Gunnar Larsson
E-mail: gunnar.larsson@ssb.no
tel.: (+47) 40 90 26 79
-
Trym Kristian Økland
E-mail: trym.okland@ssb.no
tel.: (+47) 46 81 09 15

