Content
Published:
This is an archived release.
Low annual price growth
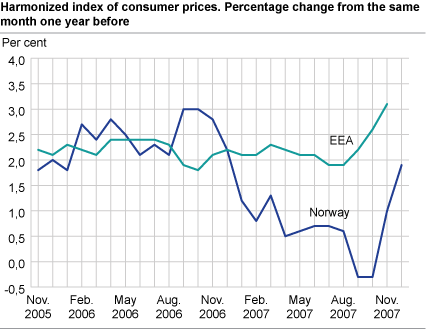
The harmonized index of consumer prices (HICP) for Norway increased by 0.7 per cent from 2006 to 2007. The relatively low annual growth was mainly due to falling prices of electricity, clothing and footwear.
Higher prices within the groups food and transport were the main contributors to the increase in the HICP.
The HICP for Norway was 105.0 (2005=100) in December 2007, compared with 103.0 in December 2006. The year-to-year growth was 1.9 per cent in December 2007, while it was 1.0 per cent in November. From November to December the HICP rose by 0.4 per cent.
See Consumer price index for more details.
EEA, EU and euro area
The HICP in November 2007 for the EEA and EU was 106.0, while it stood at 105.8 in the euro area. The year-to-year growth in November was 3.1 per cent for the EEA, the EU and the euro-area. Eurostat's flash estimate for the year-to-year growth in the HICP for the euro area is 3.1 per cent for December 2007.
| October 2006 -October 2007 | November 2006 -November 2007 | December 2006 -December 2007 | Annual growth 2006-2007 | ||||||||||||||||||||||||||||||||||||
|---|---|---|---|---|---|---|---|---|---|---|---|---|---|---|---|---|---|---|---|---|---|---|---|---|---|---|---|---|---|---|---|---|---|---|---|---|---|---|---|
| Norway | -0.3 | 1.0 | 11.9 | 10.7 | |||||||||||||||||||||||||||||||||||
| Iceland | 2.3 | 2.8 | |||||||||||||||||||||||||||||||||||||
| Sweden | 1.9 | 2.4 | |||||||||||||||||||||||||||||||||||||
| Denmark | 1.8 | 2.5 | |||||||||||||||||||||||||||||||||||||
| Finland | 1.8 | 2.1 | |||||||||||||||||||||||||||||||||||||
| Germany | 2.7 | 3.3 | |||||||||||||||||||||||||||||||||||||
| UK | 2.1 | 2 | |||||||||||||||||||||||||||||||||||||
| EEA | 2.6 | 13.1 | |||||||||||||||||||||||||||||||||||||
| EU | 2.7 | 13.1 | |||||||||||||||||||||||||||||||||||||
| Euro-area | 2.6 | 13.1 | |||||||||||||||||||||||||||||||||||||
| 1 | Provisional or preliminary figures. |
| 2 | Not available. |
| Source: Statistics Norway and EUROSTAT. | |
The statistics is now published as Consumer price index.
Contact
-
Konsumprisindeksen
E-mail: konsumprisindeksen@ssb.no
tel.: (+47) 62 88 56 34
-
Kjersti Nyborg Hov
E-mail: kjersti.nyborg.hov@ssb.no
tel.: (+47) 40 90 23 63
-
Camilla Rochlenge
E-mail: camilla.rochlenge@ssb.no
tel.: (+47) 40 90 23 72
-
Gunnar Larsson
E-mail: gunnar.larsson@ssb.no
tel.: (+47) 40 90 26 79
-
Trym Kristian Økland
E-mail: trym.okland@ssb.no
tel.: (+47) 46 81 09 15