Content
Published:
This is an archived release.
A price jump for freight transport by road
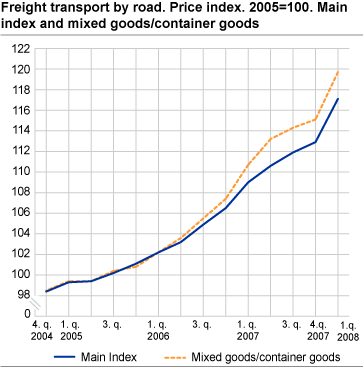
Prices of freight transport by road in Norway increased by 3.7 per cent from the fourth quarter of 2007 to the first quarter of 2008. This is the highest quarterly growth rate since 2004.
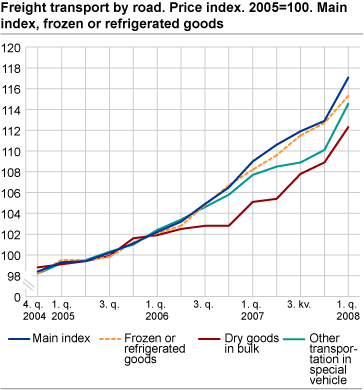
The index shows the price development for freight transport by road as a whole and for six different freight types. The industry as a whole has experienced a 3.7 per cent price jump in the first quarter of 2008. This is the highest quarterly growth rate since the inception of this price index in 2004. This significant growth is attributable to all sub-indices growing by at least 2 per cent. “Petroleum products”, “mixed goods/container goods”, and “other transportation in special vehicle” are the sub-indices which have grown the most by 8.2, 4.6, and 4.5 per cent respectively.
The annual price change has also shown a similar trend, up by 7.4 per cent from the first quarter of 2007 to the first quarter of 2008. Compared to the corresponding quarter in the previous year, “petroleum products” is the sub-index with the highest annual price rise of 11.3 per cent while the rest of the sub-indices grew by 6-8 per cent.
|
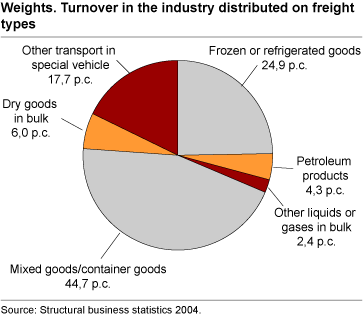
The sub-indices show the price development for transportation of the following products: Frozen or refrigerated goods, petroleum products, other liquids or gases in bulk, mixed goods/container goods, dry goods in bulk and other transportation in special vehicles. The sub-indices are weighted together in the main index using the industry turnover distributed by freight types as weights. “Mixed goods/container goods” is the largest freight type in terms of turnover, and accounts for 45 per cent of the total industry turnover. “Other liquids or gases in bulk” is the smallest freight type with 2.4 per cent of the total turnover. |
Tables:
The statistics is published with Producer price indices for services.
Contact
-
Statistics Norway's Information Centre
E-mail: informasjon@ssb.no
tel.: (+47) 21 09 46 42


