Content
Published:
This is an archived release.
House prices up 3.2 per cent
House prices increased by 3.2 per cent from the 2nd to the 3rd quarter of 2016, when adjusted for seasonal variations. Prices of flats in blocks had the highest growth by 4.6 per cent. In the same period, the prices of small houses and detached houses increased by 3.6 and 2.4 per cent respectively.
| Seasonally adjusted | 3rd quarter 2015 - 3rd quarter 2016 | |
|---|---|---|
| 2nd quarter 2016 - 3rd quarter 2016 | ||
| The whole country | 3.2 | 8.0 |
| Oslo including Bærum | 6.2 | 17.9 |
| Stavanger | 0.0 | -5.4 |
| Bergen | 0.6 | -0.3 |
| Trondheim | 3.4 | 7.4 |
| Akershus excluding Bærum | 3.3 | 10.8 |
| Sør-Østlandet | 3.0 | 8.3 |
| Hedmark and Oppland | 4.5 | 8.9 |
| Agder and Rogaland excluding Stavanger | 0.2 | -1.3 |
| Vestlandet excluding Bergen | 5.7 | 5.7 |
| Trøndelag exluding Trondheim | 1.1 | 4.8 |
| Nord-Norge | 0.2 | 7.8 |


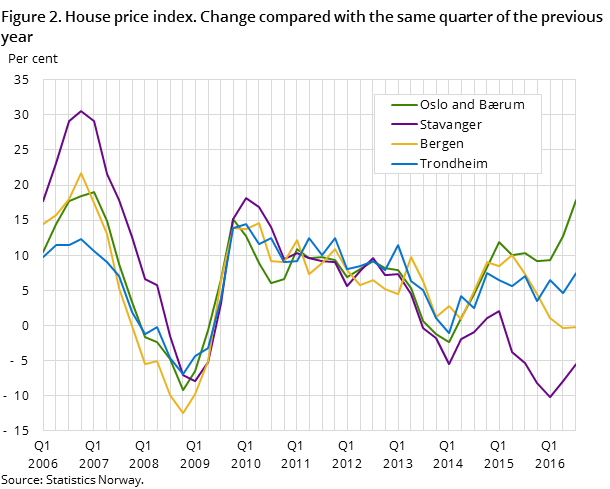
House prices in the regions Oslo and Bærum, and Western Norway excluding Bergen had the highest growth in the last quarter, with 6.2 and 5.7 per cent respectively. House prices in Stavanger are unchanged in the period.
Strongest price development in Oslo in the last year
From the 3rd quarter of 2015 to the 3rd quarter of 2016 the house prices in Norway increased on average by 8.0 per cent. The highest price increase was in Oslo and Bærum by 17.9 per cent. This is the strongest annual growth in the region since before the financial crisis in 2006/2007. The prices of flats in blocks and small houses in the capital area increased by 19.7 and 18.0 per cent respectively. Detached houses increased by 12.7 per cent.
Greatest decline in Stavanger last year
Stavanger is the region with the largest price decrease since the 3rd quarter of 2015, with an average fall of 5.4 per cent. Detached houses had the strongest decline by 7.3 per cent, while the decline for small houses and flat in blocks was 4.2 and 2.5 per cent respectively.
A total of 21 155 house sales were used in the index calculations for the 3rd quarter of 2016.
Contact
-
Per Medby
E-mail: per.medby@ssb.no
tel.: (+47) 90 24 11 27
-
Mona Takle
E-mail: mona.takle@ssb.no
tel.: (+47) 40 81 14 12
