Content
Published:
This is an archived release.
House prices flattening out
House prices decreased on average by 0.1 per cent from the third to the fourth quarter of 2010. Compared to the fourth quarter of 2009, house prices had increased by 6.6 per cent.
House prices fell by 0.1 per cent from the third to the fourth quarter last year. The largest decrease was in Hedmark and Oppland by 2.8 per cent, while Stavanger had the largest increase by 1.5 per cent.
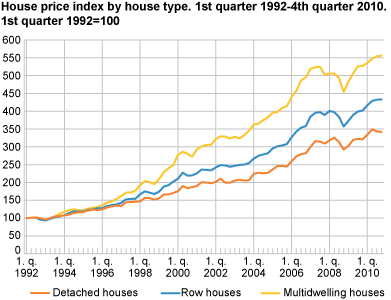
Detached houses decreased in value by 0.4 per cent from the third to the fourth quarter last year. Flats in blocks and row houses increased by 0.3 and 0.2 per cent respectively in the same period.
| 3rd quarter 2010-4th quarter 2010 | 4th quarter 2009-4th quarter 2010 | ||||||||||||||||||||||||||||||||||||||||||||||||||||||||||||||||||||||||||||||
|---|---|---|---|---|---|---|---|---|---|---|---|---|---|---|---|---|---|---|---|---|---|---|---|---|---|---|---|---|---|---|---|---|---|---|---|---|---|---|---|---|---|---|---|---|---|---|---|---|---|---|---|---|---|---|---|---|---|---|---|---|---|---|---|---|---|---|---|---|---|---|---|---|---|---|---|---|---|---|---|
| Total | -0.1 | 6.6 | |||||||||||||||||||||||||||||||||||||||||||||||||||||||||||||||||||||||||||||
| Oslo incl. Bærum | -0.2 | 6.7 | |||||||||||||||||||||||||||||||||||||||||||||||||||||||||||||||||||||||||||||
| Stavanger | 1.5 | 9.5 | |||||||||||||||||||||||||||||||||||||||||||||||||||||||||||||||||||||||||||||
| Bergen | 0.0 | 9.0 | |||||||||||||||||||||||||||||||||||||||||||||||||||||||||||||||||||||||||||||
| Trondheim | -0.4 | 9.1 | |||||||||||||||||||||||||||||||||||||||||||||||||||||||||||||||||||||||||||||
| Akershus excl. Bærum | 0.0 | 4.4 | |||||||||||||||||||||||||||||||||||||||||||||||||||||||||||||||||||||||||||||
| South Eastern Norway | -0.9 | 5.4 | |||||||||||||||||||||||||||||||||||||||||||||||||||||||||||||||||||||||||||||
| Hedmark and Oppland | -2.8 | 3.1 | |||||||||||||||||||||||||||||||||||||||||||||||||||||||||||||||||||||||||||||
| Agder and Rogaland excl. Stavanger | 0.9 | 7.2 | |||||||||||||||||||||||||||||||||||||||||||||||||||||||||||||||||||||||||||||
| Western Norway excl. Bergen | 0.0 | 5.7 | |||||||||||||||||||||||||||||||||||||||||||||||||||||||||||||||||||||||||||||
| Trøndelag excl. Trondheim | 0.0 | 9.7 | |||||||||||||||||||||||||||||||||||||||||||||||||||||||||||||||||||||||||||||
| Northern Norway | 1.1 | 7.6 | |||||||||||||||||||||||||||||||||||||||||||||||||||||||||||||||||||||||||||||
House prices increased on average by 6.6 per cent from the fourth quarter in 2009 to the same quarter in 2010. The prices of row houses increased by 7.7 per cent in this period, while detached houses and flats in blocks had a price increase of 6.4 and 5.4 per cent respectively.
From 2009 to 2010, average house prices increased by 8.3 per cent. House prices in Stavanger had the sharpest increase by 14.5 per cent, while the region Western Norway excluding Bergen had the lowest increase by 5.2 per cent.
1st quarter 1992 = 100A total of 17 652 house sales are used in the index computation for the fourth quarter of 2010. Average square metre prices, together with the full time series, can be found in “More tables in StatBank”. |
Tables:
Contact
-
Per Medby
E-mail: per.medby@ssb.no
tel.: (+47) 90 24 11 27
-
Mona Takle
E-mail: mona.takle@ssb.no
tel.: (+47) 40 81 14 12