Content
Published:
This is an archived release.
Continued decline in house prices
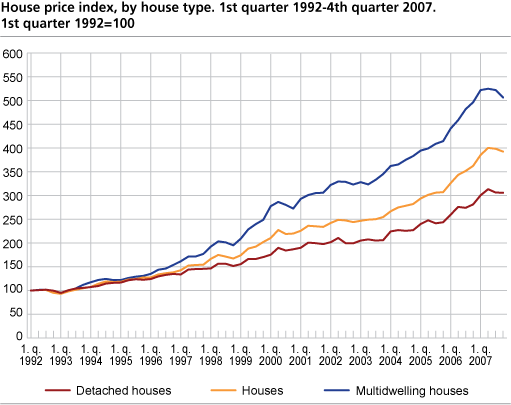
Prices of flats in apartment blocks fell by 3.0 per cent from the third to the fourth quarter of 2007. Prices of row houses fell by 1.5 per cent, while detached houses fell by 0.2 per cent.
The overall fall in house prices was 1.0 per cent from the third to the fourth quarter 2007, which means that the house prices are now 7.3 per cent higher than in the fourth quarter of 2006.
In addition to having the highest decline in the quarter, flats also had the weakest growth from the fourth quarter of 2006 to the fourth quarter of 2007 with 2.0 per cent. Prices of row houses and detached houses have increased by 8.3 and 8.7 per cent respectively in the same period.
Sharpest decline in Oslo and Bærum
The four regional house price indices show that the average price has fallen in all regions. The decline was strongest in Oslo and Bærum with 2.7 per cent, while in Stavanger, Bergen and Trondheim the prices fell by 1.5 per cent. Prices fell for all house types in all four regions with one exception; detached houses in the region ‘rest of the country’ stayed unchanged.
Seasonal adjustment
Statistics Norway has, until further notice, decided not to publish seasonally adjusted figures for the house price index. The quarterly series have proven to be unsuited for seasonal adjustment.
Prices per square metre in StatBankStatBank Norway contains average square metre prices for freeholder houses and houses in housing cooperatives. For freeholder houses annual average square metre prices for all municipalities are available, in addition to quarterly average square metre prices for counties and municipalities with 20 000 inhabitants or more. Square metre prices for houses in housing cooperatives are only presented by county. If a municipality or a county has fewer than ten sales the square metre prices are not published. Choose “More tables in StatBank” in the left margin to access the figures. A total of 16 419 house sales are used in the index computation for the fourth quarter of 2007. |
Tables:
Contact
-
Per Medby
E-mail: per.medby@ssb.no
tel.: (+47) 90 24 11 27
-
Mona Takle
E-mail: mona.takle@ssb.no
tel.: (+47) 40 81 14 12

