Content
Published:
This is an archived release.
House prices up 3.4 per cent
House prices increased by 3.4 per cent from the first to the second quarter of 2007. Adjusted for seasonal variations, the increase was 2.2 per cent.
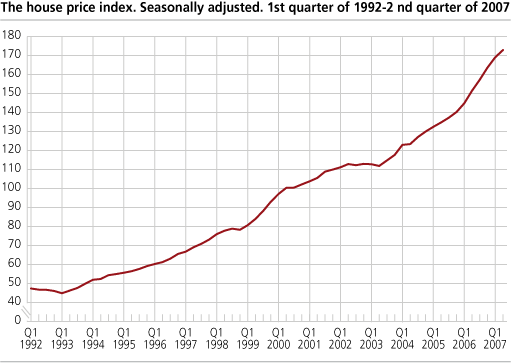
Prices of detached houses and row houses had the largest increase, up 4.3 and 3.9 per cent respectively. The increase in prices of flats was more moderate, up 0.5 per cent.
Geographical differences
Stavanger, Bergen and Trondheim had the lowest increase in house prices during the last quarter, with an increase of 1.1 per cent on average. In comparison, Oslo and Bærum saw prices rise by 2.0 per cent and Akershus (excluding Bærum) by 1.9 per cent. In the rest of the country, house prices increased by 5.0 per cent from the first to the second quarter.
Prices up 14.1 per cent last year
From the second quarter of 2006 to the second quarter of 2007, Norwegian house prices increased by 14.1 per cent. Furthermore, the growth in prices was almost identical in the four geographical zones. With a 16.5 per cent increase, row houses had the strongest increase in this period, while flats and detached houses increased by an average of 14.4 and 13.5 per cent respectively.
A total of 19 309 sales were used in the calculation of the house price index.
Tables:
- Table 1 House price index. All dwellings. 2000=100
- Table 2 House price index . All dwellings. Seasonally adjusted. 2000=100
- Table 3 House price index. Freeholder. 2000=100
- Table 4 House price index. Housing cooperative. 2000=100
- Table 6 International comparison. Prices of detached houses. Price change the last quarter and year
Contact
-
Per Medby
E-mail: per.medby@ssb.no
tel.: (+47) 90 24 11 27
-
Mona Takle
E-mail: mona.takle@ssb.no
tel.: (+47) 40 81 14 12