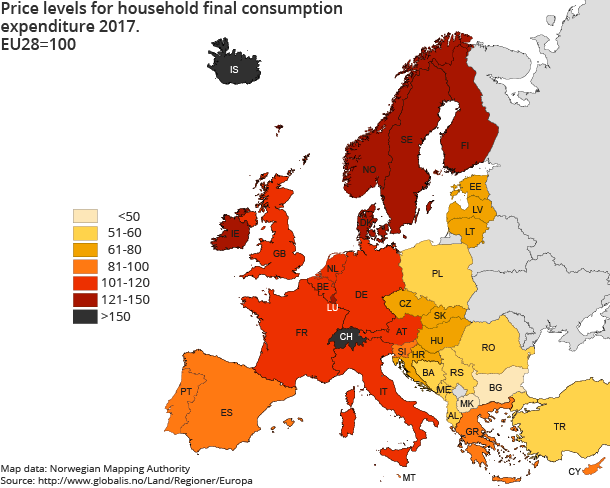
Iceland, Switzerland and Norway still most expensive
Published:
Results from a recently released price level survey conducted by Eurostat show that Norway had the third highest price levels in Europe in 2017. Iceland and Norway stood out with prices around double that of the rest of Europe for alcoholic beverages and tobacco.
- Full set of figures
- Price level for consumer goods and services
- Series archive
- Price level for consumer goods and services (archive)
In 2017, the EFTA countries of Iceland, Switzerland and Norway still had Europe’s highest price levels for goods and services for Household Final Consumption Expenditure (HFCE). These were 66, 59 and 43 per cent above the EU28 average respectively. Denmark, Sweden, Finland, Luxembourg and Ireland also had high price levels, which were between 22 and 42 per cent above the EU28 average. The lowest price levels in the survey were found in a number of the Balkan countries. Macedonia and Bulgaria had price levels below 50 per cent of the EU28 average.
Food and alcoholic beverages most expensive in EFTA countries
Switzerland together with Norway and Iceland had the highest European price levels for food and non-alcoholic beverages in 2017, while Macedonia, Romania and Poland had the lowest prices. For alcoholic beverages and tobacco, Iceland and Norway topped the list with prices around double that of the rest of Europe. The other Nordic countries as well as Ireland and the United Kingdom also stood out as expensive for alcoholic beverages and tobacco. Common to all these countries is the high excise duties applied to these consumables. The cheapest alcoholic beverages and tobacco were found in Macedonia, Serbia, Bosnia and Herzegovina and Albania.
Figure 1. Price levels in the Nordic countries according to ECOICOP division. Indices 2017. EU28=100
| Miscellaneous goods and services | Restaurants and hotels | Education | Recreation and culture | Communication | Transport | Health | Household furnishings, equipment and maintenance | housing, water, electricity, gas and other fuels | Clothing and footwear | Alcoholic beverages, tobacco and narcotics | Food and non-alcoholic beverages | |
| Iceland | 169 | 186 | 203 | 172 | 149 | 145 | 200 | 142 | 139 | 176 | 228 | 156 |
| Norway | 163 | 165 | 204 | 154 | 124 | 144 | 184 | 129 | 121 | 131 | 226 | 161 |
| Denmark | 140 | 151 | 154 | 148 | 98 | 128 | 135 | 120 | 153 | 133 | 123 | 150 |
| Sweden | 138 | 146 | 192 | 131 | 124 | 118 | 168 | 119 | 112 | 134 | 127 | 126 |
| Finland | 127 | 129 | 120 | 122 | 81 | 113 | 135 | 111 | 131 | 123 | 139 | 118 |
Cheap holiday in the Balkans
For prices of goods and services that impact on holiday budgets, price levels are noticeably lower in several Balkan countries compared to the European average. In Albania, Macedonia and Bulgaria, price levels in restaurants and hotel services were at least 55 per cent lower compared to the European average. For recreation and culture services, prices were as low as 50 per cent below EU28, and for the group transportation services prices in the Balkans are around 30 per cent lower than the European average. Similar services in northern Europe are clearly more expensive, partly due to salary levels.
Price levels in the Nordic countries
Eurostat statistics show how much households in European countries pay for goods and services. In 2017, Norway had the most expensive food and non-alcoholic beverages, while Denmark was most expensive for the group housing, water, electricity, gas and other fuels. Denmark’s prices for this group were 10 per cent higher than Iceland, 17 per cent higher than Finland, 26 per cent higher than Norway and 37 per cent higher than Sweden. Finland was the cheapest Nordic country. Iceland had relatively high price levels for household furnishings, equipment and maintenance; most probably due to the transport costs to the island nation.
Contact
-
Estrellita Rauan
-
Knut Linnerud
-
Statistics Norway's Information Centre

