Content
Published:
This is an archived release.
Increased revenue from 1995 to 2005
Between 1995 and 2005, the public sector has been characterised by growth in both revenue and expenditure, but also by reforms that have changed the sector. Statistics Norway has carried out a revision of general government revenue and expenditure for the years 1995-2005.
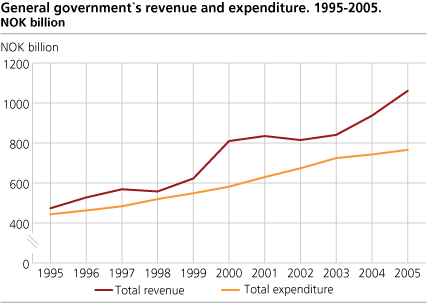
In the last decade there has been a strong increase in general government revenue. Total revenue amounted to more than NOK 1 000 billion in 2005. This is more than twice as much as in 1995, when total revenue was NOK 474 billion (all numbers are in current prices). The increase in government revenue is mainly due to high oil prices that allocate a high income from petroleum activities. The increased petroleum-related revenue primarily comes from operating profits from the State`s Direct Financial Interest (SFDI) and as higher government tax revenue.
Higher surplus despite growth in expenditure
General government total expenditure has also increased in the period, from NOK 444 billion in 1995 to NOK 766 billion in 2005. Transfers to the private sector amounted to NOK 192 billion in 1995, and increased to NOK 318 billion in 2005. Pensions make up the highest share of the transfers, while sickness and maternity benefits and vocational rehabilitation benefits have had the highest relative increase. Final consumption expenditure amounted NOK 204 and NOK 391 billion respectively in 1995 and 2005. Expenditure has increased, but revenue has increased even more. Net lending as a per cent of GDP was 3.2 per cent in 1995, and in 2005 this share was 15.2 per cent. This measurement of surplus must be interpreted with caution as it varies considerably due to changing revenue from the petroleum sector.
Many reforms
Since the beginning of the 1990s there has been a considerable number of reorganisations and reforms in general government. These reforms have been carried out using different measures, including increased use of net budgeting, the transfer of tasks from one level of government to another, the creation of public corporations and privatisation.
Central government has been changed through net budgeting of government activities. Net budgeting implies that units with a high degree of independence in professional or value matters are given special authorities when it comes to resource allocation and internal management. Among these are the Norwegian Research Council, universities, colleges and capital management units such as the Government Pension Fund - Global (previously the Government Petroleum Fund) and the Government Pension Fund - Norway (previously the National Insurance Scheme Fund). These units’ development is presented in the table "Other central government and social security accounts".
The creation of public corporations implies that these units no longer are a part of general government, and therefore are excluded from these statistics. There are examples of this in the period, for instance the production activities of the Norwegian Public Roads administration were transferred to the new public corporation Mesta AS in 2003.
There are also examples of public corporations which have been privatised in the period, with Telenor and Statoil being the most important. Telenor was transformed from a state monopoly to a commercial public corporation in 1994, in 2000 the company was partly privatised and it is now traded on the stock exchange. The same was the case for Statoil in 2001.
In some parts of the period 1995-2005, local government has experienced a rather difficult financial situation. As a result, local authorities have looked for ways to organise their services more efficiently. For instance, a number of units have been separated from the primary activities and organised as local government enterprises, municipal enterprises or inter municipal enterprises.
More tasks for central government
The responsibility for a number of welfare tasks has been moved between the levels of government. The most important change is that the responsibility for hospitals was transferred from the county municipalities to the central government in 2002, leading to a move of approximately 100 000 employees from local government to central government.
|
Change in the tables
Due to the revision there are two changes in the tables compared with previously published figures. The first is an enlargement of the tables with calculated figures for indirectly measured financial intermediation services (FISIM). Financial corporations provide services that they do not charge for explicitly through specific fees or commissions. Instead they have incomes from net receipts of interests, margin of interest. This means that financial institutions pay lower rates on interest on deposits etc than the interest charged on loans etc. Since these services are set against administration and use of resources, they are considered as output of these financial institutions. Until now the national accounts have included these financial intermediation services indirectly measured as output in financial service industry, while not being allocated to uses. This has meant that the share of government and other sectors' use of these services has not been published in any tables. In the revised tables general government use of financial intermediation services indirectly measured is a part of "Intermediate consumption" under "Final consumption expenditure". A balancing item is placed as revenue under "Property income", so the surplus is not affected. Financial intermediation services indirectly measured was calculated to approximately NOK 4 billion in 2005, the greater amount is found in Local government. The second revision implies an adjustment to international standards. Net revenue from withdrawals from the income of quasi-corporations is placed as "Property income" instead of as "Other current transfers” as earlier. In addition, a new method for estimating accrued value added tax has lead to lower VAT revenue for the central government. Saving in general government is therefore lower than previously estimated, while net lending is unchanged. |
Figures from 1999 are presented under "tables". Previous years can be found in StatBank.
This page has been discontinued, see General government revenue and expenditure, Quarterly.
Contact
-
Eivind Andreas Sirnæs Egge
E-mail: eivind.egge@ssb.no
tel.: (+47) 91 69 05 03
-
Frode Borgås
E-mail: frode.borgas@ssb.no
tel.: (+47) 40 90 26 52
-
Aina Johansen
E-mail: aina.johansen@ssb.no
tel.: (+47) 40 90 26 66