Content
Published:
This is an archived release.
New classification of government expenditure
Statistics Norway has carried out a revision of general government finance. As part of this revision, a new classification of government expenditure (COFOG) was introduced for the period 1990-2001.
The revision of general government involves changes in central and local government expenditures by function. The revised figures also entail an upward adjustment in general government consumption, caused by new estimates for consumption of fixed capital . However, this adjustment does not imply major changes in the revised figures as a percentage of the Gross Domestic Product (GDP).
New COFOG
The new COFOG was introduced as a part of the revision of the general government finances. The UN, the OECD, the World Bank, the IMF and the EU approved the new COFOG in the spring 1999.
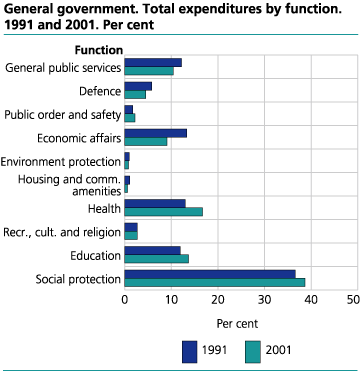
Diagram 1 shows that social protection represents close to 40 per cent of total expenditures in 2001, a slight increase since 1991.
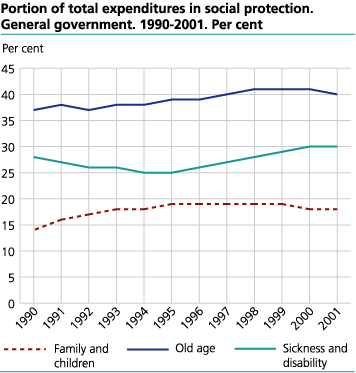
Diagram 2 shows that sickness and disability , old age and family and children have a fairly stable portion of the total expenditure of social protection during this period.
Published 14 June 2002 (C) Statistics NorwayThis page has been discontinued, see General government revenue and expenditure, Quarterly.
Contact
-
Eivind Andreas Sirnæs Egge
E-mail: eivind.egge@ssb.no
tel.: (+47) 91 69 05 03
-
Frode Borgås
E-mail: frode.borgas@ssb.no
tel.: (+47) 40 90 26 52
-
Aina Johansen
E-mail: aina.johansen@ssb.no
tel.: (+47) 40 90 26 66


