Content
Published:
This is an archived release.
Higher deficit for municipalities
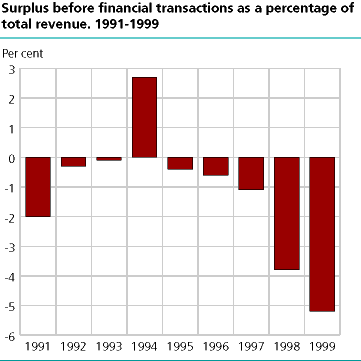
Local government ended up with a deficit before financial transactions of about NOK 9.8 billion in 1999, about NOK 3.6 billion more than the previous year.
The county municipalities and City of Oslo saw their deficits increase by NOK 1.1 and 3.0 billion respectively, while the other municipalities can show a slight improvement.
Expenditures grow faster than revenues
Both revenues and expenditures increased in 1999. Revenues increased by 5.9 per cent, while current expenditures increased by 7.3 per cent. This led to a sharp reduction in local government saving of nearly NOK 2 billion or 25.8 per cent. Increased wages and salaries are a major cause of the higher expenditures. Local government wages and salaries increased by NOK 8.7 billion or 7.5 per cent from 1998 to 1999. The increase in total local government revenues is mainly attributed to higher central government transfers. Transfers from central government increased by NOK 7 billion, and accounted for two-thirds of the growth in total revenues.
|
Local government. Revenue and expenditure
by type. 1998-1999. Million kroner |
| 1998* | 1999* |
Change
98/99 |
|||||||||||||||||||||||||||||||||||||
|---|---|---|---|---|---|---|---|---|---|---|---|---|---|---|---|---|---|---|---|---|---|---|---|---|---|---|---|---|---|---|---|---|---|---|---|---|---|---|---|
| A. CURRENT REVENUE | 178 163 | 188 748 | 5,9 | ||||||||||||||||||||||||||||||||||||
| 1. Property income, interest | 4 291 | 6 124 | 42,7 | ||||||||||||||||||||||||||||||||||||
| 2. Tax revenue | 88 640 | 89 968 | 1,5 | ||||||||||||||||||||||||||||||||||||
| 3. Other current transfers | 81 746 | 88 818 | 8,7 | ||||||||||||||||||||||||||||||||||||
| Transfers between government sectors | 79 103 | 86 141 | 8,9 | ||||||||||||||||||||||||||||||||||||
| Other transfers | 2 643 | 2 677 | 1,3 | ||||||||||||||||||||||||||||||||||||
| 4. Operating surplus1 | 3 486 | 3 838 | 10,1 | ||||||||||||||||||||||||||||||||||||
| C. TOTAL REVENUE (=A) | 178 163 | 188 748 | 5,9 | ||||||||||||||||||||||||||||||||||||
| D. CURRENT EXPENDITURE | 170 608 | 183 140 | 7,3 | ||||||||||||||||||||||||||||||||||||
| 1. Property expenditure, interest | 4 829 | 6 053 | 25,3 | ||||||||||||||||||||||||||||||||||||
| 2. Transfers to the private sector | 19 958 | 20 620 | 3,3 | ||||||||||||||||||||||||||||||||||||
| 3. Other current transfers | 1 261 | 1 863 | 47,7 | ||||||||||||||||||||||||||||||||||||
| Transfers between government sectors | 1 515 | 1 607 | 6,1 | ||||||||||||||||||||||||||||||||||||
| Transfers to municipal enterprises | -254 | 256 | -200,8 | ||||||||||||||||||||||||||||||||||||
| 4. Final consumption expenditure | 144 560 | 154 604 | 6,9 | ||||||||||||||||||||||||||||||||||||
| Wages and salaries | 116 331 | 125 060 | 7,5 | ||||||||||||||||||||||||||||||||||||
| Intermediate consumption | 40 459 | 43 345 | 7,1 | ||||||||||||||||||||||||||||||||||||
| Consumption of fixed capital | 8 907 | 9 660 | 8,5 | ||||||||||||||||||||||||||||||||||||
| Social benefits in kind | 3 448 | 3 624 | 5,1 | ||||||||||||||||||||||||||||||||||||
| Correction for operating surplus1 | 3 486 | 3 838 | 10,1 | ||||||||||||||||||||||||||||||||||||
| Administrative fees and charges (-) | -28 071 | -30 923 | 10,2 | ||||||||||||||||||||||||||||||||||||
| E. SAVING (A-D) | 7 555 | 5 608 | -25,8 | ||||||||||||||||||||||||||||||||||||
| F. CAPITAL EXPENDITURE | 13 752 | 15 373 | 11,8 | ||||||||||||||||||||||||||||||||||||
| 1. Net fixed capital formation | 14 635 | 15 694 | 7,2 | ||||||||||||||||||||||||||||||||||||
| Gross fixed capital formation | 23 542 | 25 354 | 7,7 | ||||||||||||||||||||||||||||||||||||
| Consumption of fixed capital (-) | -8 907 | -9 660 | 8,5 | ||||||||||||||||||||||||||||||||||||
| 2. Net purchase of land | -966 | -279 | -71,1 | ||||||||||||||||||||||||||||||||||||
| 3. Capital transfers | 83 | -42 | -150,6 | ||||||||||||||||||||||||||||||||||||
| G. TOTAL EXPENDITURE (D+F) | 184 360 | 198 513 | 7,7 | ||||||||||||||||||||||||||||||||||||
| H. NET LENDING/BORROWING (C-G) | -6 197 | -9 765 | 57,6 | ||||||||||||||||||||||||||||||||||||
| 2. Surplus before financial transactions | -6 197 | -9 765 | 57,6 | ||||||||||||||||||||||||||||||||||||
| 1 | Operating surplus in municipal water supply, sewage disposal and refuse collection activities. |
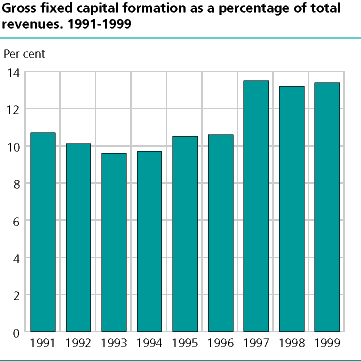
Still high level of investment
Gross fixed capital formation increased by NOK 1.8 billion or 7.7 per cent in relation to 1998 in current prices. Gross fixed capital formation in 1999 was 13.4 per cent of total revenues. This is about the same as during the two previous years, and shows the high level of investment in local government in 1997 and 1998 continued in 1999.
Net borrowing
The local government deficit or net borrowing a major indicator in assessing the health of local government finances, was NOK 9.8 billion in 1999, NOK 3.6 billion more than in 1998. This is the worst result since 1988. For the municipalities the deficit before financial transactions was NOK 7.3 billion and for the county municipalities the deficit was NOK 2.4 billion in 1999. The City of Oslo alone accounted for NOK 2.3 billion of the deficit, which makes up nearly one-third of the municipal deficit.
The statistics are issued annually.
Tables:
The statistics is published with General government revenue and expenditure.
Contact
-
Statistics Norway's Information Centre
E-mail: informasjon@ssb.no
tel.: (+47) 21 09 46 42