Content
Published:
This is an archived release.
Wastewater pipelines renewed at an average annual rate of 0.5 per cent
There are around 33 200 kilometres of municipal wastewater pipelines in Norway, corresponding to 4/5 of the circumference of the earth. One fifth of it has been installed before 1960. From 2002-2004, average renewal rate of municipal wastewater pipelines is calculated on annual basis to be on average 0.56 per cent.
That is what calculations based on KOSTRA (Municipality-State-Reporting) 2004 illustrate.
Renewal of wastewater pipelines is of critical importance in order to prevent damage to buildings and pollution to the environment through leakages. Leaking pipelines can also contribute to increased treatment costs as surface water and groundwater may enter the pipelines. In 2004 it was estimated around 540 number of closed cases of basement flooding where municipality has accepted liability and around 5000 sewage overflows in pipeline, storm water system and manhole covers.
Estimations show that there are totally around 33 200 kilometres of municipal wastewater pipelines in the country. For comparison the circumference of the earth on the equator is around 40 070 kilometres. During the years 2002-2004, the average renewal rate of wastewater pipelines is reported to be around 0.56 per cent per year. This equals a lifetime of around 180 years, given the same rate also in the future.
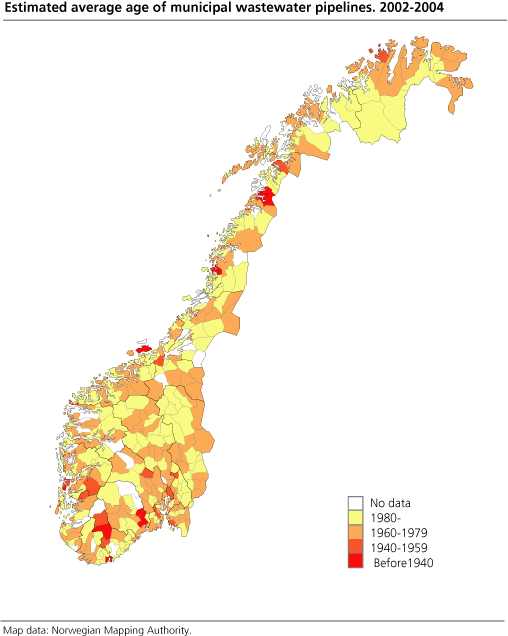
Regionally, annual average renewal rate is about 0.51 per cent in the North Sea counties (Østfold to Vest-Agder), and around 0.62 per cent for the rest of the country. The pipeline system, however, is longer and more extensive in the North Sea counties, thus total renewal is somewhat larger in the North Sea counties (around 95 kilometres) compared to the rest of the country (around 90 kilometres). The figures also show that around 12 per cent of wastewater pipelines ha been installed before 1940, and 9 per cent from 1940-59. The remainder is of more recent date.
93 per cent connected to high grade treatment plants in the North Sea counties
The requirements given to the treatment plants in different areas of the country varies substantially. The most stringent requirements are given to plants in the North Sea counties (from Østfold to Vest-Agder) in order to make it possible for Norway to fulfil the obligations towards the conservation of the North Sea marine environment. In addition, the EU Urban Waste Water directive (91/271/EEC) also constitutes a framework for Norwegian wastewater policy.
Norway has invested heavily in efficient treatment facilities in the North Sea counties since the beginning of the nineteen eighties. Today 93 per cent of the population in this area is connected to treatment plants with chemical and/or biological treatment. Norway has already reached the target of a fifty per cent reduction of phosphorus discharges to the North Sea with 1985 as a baseline. However, Norway is still below the target for reduction of nitrogen, even though treatment efficiencies have showed a positive trend the last couple of years.
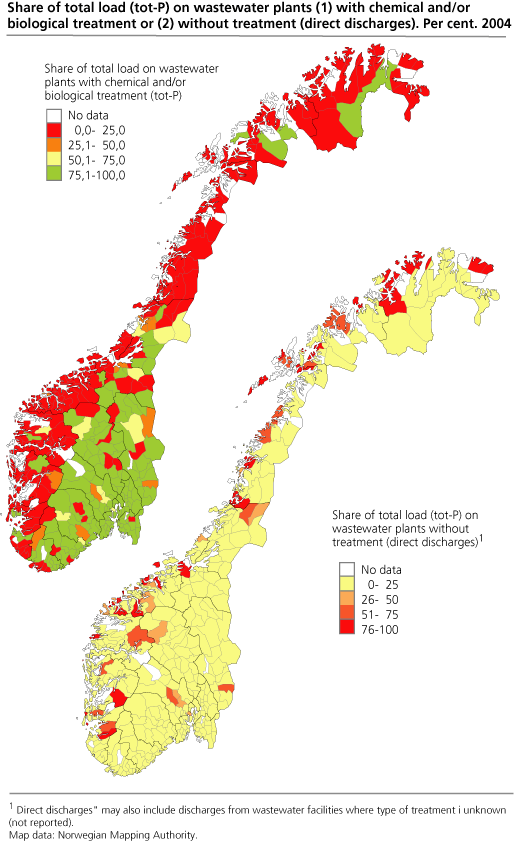
Outside the North Sea counties, the needs for treatment are substantially lower, primarily because of less critical recipient conditions. The pollution loads are generally also much lower here because of lighter population pressures and industrial development in the area, although exceptions exist. 31 per cent of the population in this area is reported as connected to chemical and/or biological treatment plants.
Number of wastewater treatment plants stable
Altogether around 2 200 wastewater plants (including direct discharges) were reported in 2004, of which 1 800 were owned by the municipalities. In urban areas of southern Norway, inter-municipal ownership is common. Small plants designed for less than 50 persons are still common in areas with scattered population. Large shares of these plants are individual plants not connected to the municipal sewer system. 82 per cent of the country's population is reported as connected to the municipal sewage system.
50 per cent of the sewage sludge used as fertiliser
Altogether 50 per cent of the sewage sludge produced by the treatment plants was used as fertiliser in agricultural fields, parks and other green areas, and in soil production in 2004. The use of sludge as fertiliser is more common in the North Sea counties (nearly 55 per cent of the produced sludge). This is also where the country's largest agricultural areas are situated. Only 33 per cent of the produced sludge was used for the same purposes outside the North Sea counties.
|
Selected key indicators for the North Sea counties compared to the rest of the country1.
2002 and 2004 |
| The whole country | The North Sea counties | Rest of the counties | |||||||||||||||||||||||||||||||||||||
|---|---|---|---|---|---|---|---|---|---|---|---|---|---|---|---|---|---|---|---|---|---|---|---|---|---|---|---|---|---|---|---|---|---|---|---|---|---|---|---|
| 2002 | 2004 | 2002 | 2004 | 2002 | 2004 | ||||||||||||||||||||||||||||||||||
| Total number of wastewater plants reported | 2 549 | 2 207 | 645 | 622 | 1 904 | 1 585 | |||||||||||||||||||||||||||||||||
| Plants with municipal ownership | 2 103 | 1 798 | 460 | 414 | 1 643 | 1 384 | |||||||||||||||||||||||||||||||||
| Share of total load (tot-P) on treatment plants that fulfil all their requirements. Per cent | 55 | 63 | 54 | 50 | 56 | 80 | |||||||||||||||||||||||||||||||||
| Share of total load (tot-P) on plants with chemical treatment. Per cent | 39 | 39 | 54 | 49 | 14 | 25 | |||||||||||||||||||||||||||||||||
| Share of total load (tot-P) on plants with biological-chemical treatment. Per cent | 27 | 28 | 41 | 45 | 4 | 4 | |||||||||||||||||||||||||||||||||
| Share of total load (tot-P) on plants with other types of treatment. Per cent | 26 | 27 | 4 | 4 | 61 | 57 | |||||||||||||||||||||||||||||||||
| Share of sludge used as fertiliser. Per cent | 40 | 50 | 68 | 55 | 8 | 33 | |||||||||||||||||||||||||||||||||
| Share of sludge used for other purposes. Per cent | 53 | 16 | 25 | 14 | 85 | 23 | |||||||||||||||||||||||||||||||||
| 1 | Wastewater treatment facilities larger than 50 pe. Shares do not necessarliy equal 100 per cent due to discrepancies between some of the reported figures used in the estimations of the indicators. |
| Connection to municipal wastewater treatment facilities1, by type of treatment. 2002 and 2004. Per cent |
| The whole country | The North Sea counties | Rest of the counties | |||||||||||||||||||||||||||||||||||||
|---|---|---|---|---|---|---|---|---|---|---|---|---|---|---|---|---|---|---|---|---|---|---|---|---|---|---|---|---|---|---|---|---|---|---|---|---|---|---|---|
| 2002 | 2004 | 2002 | 2004 | 2002 | 2004 | ||||||||||||||||||||||||||||||||||
| Share of population connected to the municipal sewerage system | 82 | 82 | 86 | 85 | 78 | 79 | |||||||||||||||||||||||||||||||||
| Share of population connected to plants with chemical treatment | 34 | 37 | 50 | 47 | 11 | 24 | |||||||||||||||||||||||||||||||||
| Share of population connected to plants with biological-chemical treatment | 26 | 26 | 43 | 42 | 3 | 3 | |||||||||||||||||||||||||||||||||
| Share of population connected to plants with other types of treatment | 25 | 24 | 5 | 4 | 53 | 52 | |||||||||||||||||||||||||||||||||
| Share of population connected to plants without treatment | 8 | 6 | 1 | 0 | 18 | 14 | |||||||||||||||||||||||||||||||||
| 1 | Shares include connection to municipal treatment facilities larger than 50 pe. The shares do not necessarily equal 100 per cent due to discrepancies between some of the reported figures used in the estimations of the indicators. |
The figures presented above must be considered as preliminary, and may be adjusted in the final publication later this year on the discharges and treatment in the municipal wastewater sector 2004.
See also : KOSTRA: Municipal water and Turnover statistics in the sewage and refuse sector
Tables:
The statistics is now published as Municipal wastewater.
Contact
-
Gisle Berge
E-mail: gisle.berge@ssb.no
tel.: (+47) 48 12 19 97