Content
Published:
This is an archived release.
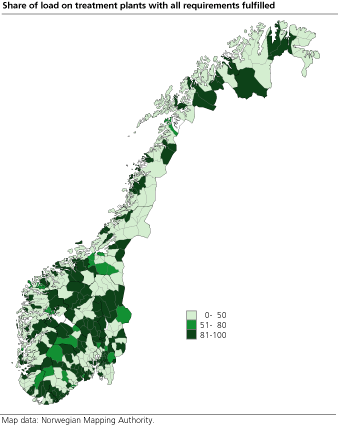
Half the wastewater treated according to all requirements
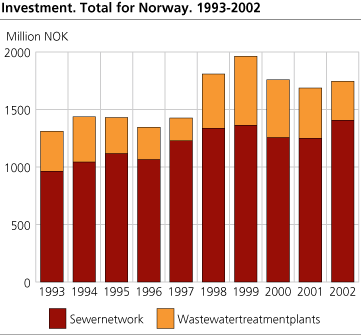
Only 55 per cent of the wastewater passing Norwegian wastewater plants was treated according to all the requirements stated in the plants' discharge permissions in 2002. Investments in the wastewater treatment plants decreased, while investments in the sewer network increased last year.
The requirements given to the treatment plants in different areas of the country varies substantially. The heaviest requirements are given to plants in the North Sea counties - that is the counties along the coast from Østfold to Vest-Agder - in order to make it possible for Norway to fulfil the obligations towards to the North Sea treaties and the OSPAR convention on the conservation of the North Sea marine environment.
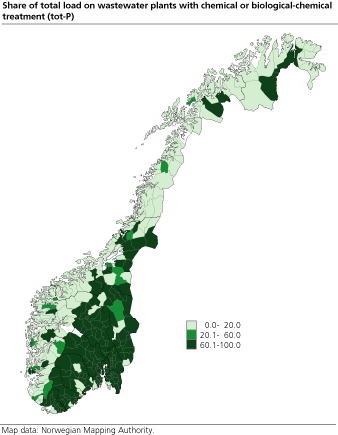
Almost all people connected to high grade treatment plants in the North Sea counties
Norway has invested heavily in efficient treatment facilities in the North Sea counties since the beginning of the 1980s. In 2002 93 per cent of the population in this area was connected to treatment plant with chemical or biological-chemical treatment. Norway has already reached the target of 50 per cent reduction of the discharges of phosphorus to the North Sea with 1985 as a baseline, but is still below the target for reduction of nitrogen. However, the treatment efficiencies have showed a positive trend the last couple of years. Outside the North Sea counties the needs for treatment are substantially lower, and only 8 per cent of the population in this area was connected to chemical or biological-chemical treatment plants.
Altogether 2 549 wastewater plants (including direct discharges) were reported for in 2002, of which 2 103 were owned by the municipalities. In urban areas of southern Norway, inter-municipal ownership is common. Small plants designed for less than 50 persons are still common in areas with scattered population. A big share of these plants are individual plants not connected to the municipal sewer system. 82 per cent of the country's population was connected to the municipal sewer system.
40 per cent of the sewage sludge used as fertiliser
Altogether 40 per cent of the sewage sludge produced by the treatment plants was used as fertiliser in agricultural fields, parks and other green areas in 2002. This is an increase of 3 per cent from the year before. In the North Sea counties - where the country's largest agricultural areas are situated - 68 per cent of the produced sludge was used for these purposes. Only 8 per cent of the produced sludge was used for the same purposes outside the North Sea counties.
The figures presented above must be considered as preliminary, and may be adjusted in the final publication later this year on the discharges and treatment in the municipal wastewater sector 2002.
| Selected key indicators for the North Sea counties compared to the rest of the country1 |
| The whole country | The North Sea counties | The rest of the country | |||||||||||||||||||||||||||||||||||||
|---|---|---|---|---|---|---|---|---|---|---|---|---|---|---|---|---|---|---|---|---|---|---|---|---|---|---|---|---|---|---|---|---|---|---|---|---|---|---|---|
| Total number of wastewater plants reported | 2 549 | 645 | 1 904 | ||||||||||||||||||||||||||||||||||||
| Plants with municipal ownership | 2 103 | 460 | 1 643 | ||||||||||||||||||||||||||||||||||||
| Share of population connected to the municipal sewerage system | 82 | 86 | 78 | ||||||||||||||||||||||||||||||||||||
| Share of total load (tot-P) on treatment plants that fulfil all their requirements | 55 | 54 | 56 | ||||||||||||||||||||||||||||||||||||
| Share of total load (tot-P) on plants with chemical treatment | 39 | 54 | 14 | ||||||||||||||||||||||||||||||||||||
| Share of total load (tot-P) on plants with biological-chemical treatment | 27 | 41 | 4 | ||||||||||||||||||||||||||||||||||||
| Share of total load (tot-P) on plants with other types of treatment | 26 | 4 | 61 | ||||||||||||||||||||||||||||||||||||
| Share of population connected to plants with chemical treatment | 34 | 50 | 11 | ||||||||||||||||||||||||||||||||||||
| Share of population connected to plants with biological-chemical treatment | 26 | 43 | 3 | ||||||||||||||||||||||||||||||||||||
| Share of population connected to plants with other types of treatment | 25 | 5 | 53 | ||||||||||||||||||||||||||||||||||||
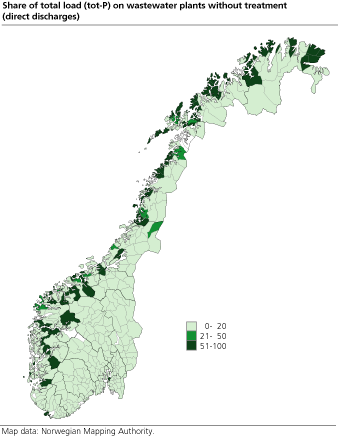
| Share of population connected to plants without treatment | 8 | 1 | 18 | ||||||||||||||||||||||||||||||||||||
| Share of sludge used as fertiliser | 40 | 68 | 8 | ||||||||||||||||||||||||||||||||||||
| Share of sludge used for other purposes | 53 | 25 | 85 | ||||||||||||||||||||||||||||||||||||
| Share of sludge deposited | 7 | 7 | 8 | ||||||||||||||||||||||||||||||||||||
| 1 | Shares do not necessarliy equal 100 per cent due to discrepancies between some of the reported figures used in the estimations of the indicators. |
Investment increases again
Investment in the municipal wastewater sector was 1 745 million NOK in 2002, which is an increase of 3.5 per cent in relation to 2001. In 2001 and 2002 investments decreased slightly, but this trend now appears to have changed. The investments in the sewer network account for the majority of the investment in this sector. Investments in the sewer network increased 12.6 per cent from 2001 to 2002.
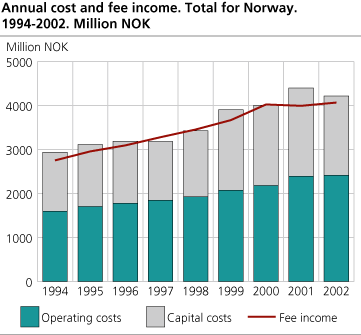
...but annual costs decrease
For the first time since 1994, annual costs in the municipal wastewater sector have decreased. In 2002, total annual costs were 4 215 million NOK, and this is a decrease of 4.1 per cent compared with the year before. It is possible that the new and longer depreciation times now being used in these calculations have influenced these statistics. The longer depreciation time periods for the sewer network result in lower annual capital costs. However, since the capital costs are depreciated over a longer time period, the total capital costs will in the end be higher. At the same time it is possible that the 2001 figures were too high, so that the picture has not changed as radically as the figure appears to show. There has been a fairly high level of uncertainty with respect to the change over to the new annual costs calculation methods in KOSTRA between 2000 and 2001. This break in the time series is represented in the figure.
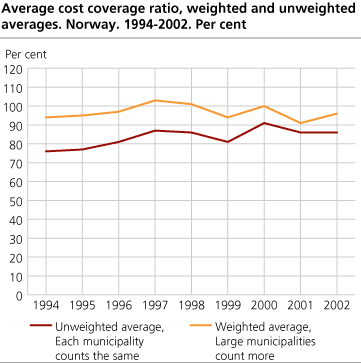
... and the municipalities subsidise wastewater services
The media often focuses on municipalities collecting more fee income than they are authorized to. Statistics for the wastewater sector shows, however, that on a national basis the annual costs have been higher than the income from fees for the entire time series for these statistics. The deficit is covered by the municipalities through other financing sources. In 2002, the average cost coverage ration was 86 per cent. It is the smaller municipalities that pull down this average. On a national basis the relationship between fee income and annual costs was 96 per cent.
Tables:
The statistics is now published as Municipal wastewater.
Contact
-
Gisle Berge
E-mail: gisle.berge@ssb.no
tel.: (+47) 48 12 19 97