Content
Published:
This is an archived release.
0.6 per cent of sewage system renewed
In 2015, 230 out of the 36 800 kilometres of the existing sewage pipeline system was renewed, representing 0.62 per cent. Furthermore, only 32 per cent of the inhabitants were connected to wastewater facilities which complied with their treatment permits.
| 2011 | 2014 | 2015 | Change in per cent | ||
|---|---|---|---|---|---|
| 2011 - 2015 | 2014 - 2015 | ||||
| Percentage of population connected to municipal wastewater facilities | 84.1 | 84.3 | 84.2 | 0.1 | -0.1 |
| Connection density of wastewater pipeline system (inhabitants/km) | 117 | 119 | 119 | 1.7 | 0.0 |
| Percentage of total wastewater pipeline system renewed, 3-year-average | 0.46 | 0.54 | 0.57 | 23.9 | 5.6 |
| Number of sewage overflow in sewage pipelines and manhole covers per km pipeline | 0.067 | 0.052 | 0.048 | -28.4 | -7.7 |
| Income from fees per inhabitant connected to municipal wastewater facilities | 1 376 | 1 526 | 1 636 | 18.9 | 7.2 |
| Operating expenditures per inhabitant connected to municipal wastewater facilities | 940 | 1 134 | 1 130 | 20.2 | -0.4 |
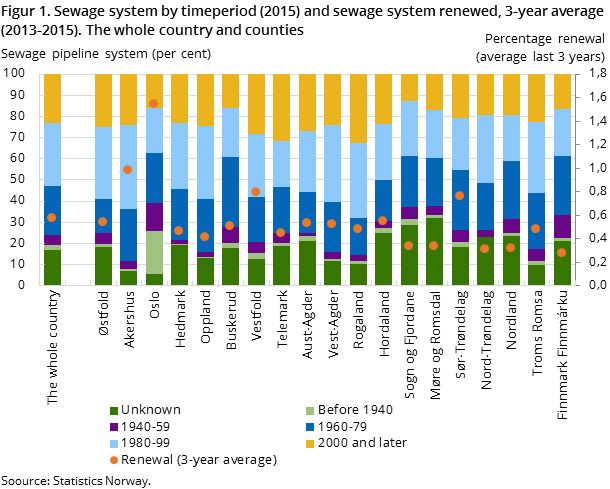
In the perspective of 0.62 per cent renewal of the existing sewage pipeline system, installation of new sewage pipelines over the same time period constituted 370 kilometres, corresponding to 1.02 per cent. Thus, the rate of installation of new pipelines is significantly faster than renewal; a situation that has remained the same since 2002, when registrations started. Unless renewal rates increase, aging sewage pipelines throughout the municipalities will be the unavoidable result. Even without new installations it will take more than 160 years to renew the whole pipeline system with the current renewal rate.
The age of the sewage pipeline system for the country as a whole has been estimated at around 30 years old (37 years when adjusted for pipelines laid down in an unknown period – constituting 17 per cent of the total length). Around 2.3 per cent of the municipal wastewater pipelines were installed before 1940, while 53 per cent were installed in 1980 or later.
Highest renewal rates in Oslo, Akershus and Vestfold
Renewals tend to vary from one year to another. The key figure «Percentage of total sewage pipeline system renewed, 3-year moving average» will even out these cyclical variations.
For the period 2013-2015, Oslo and the municipalities in the counties of Akershus and Vestfold saw the most renewals on average per year, with 1.54, 0.98 and 0.79 per cent respectively, while Finnmark, Nord-Trøndelag and Nordland renewed the least, with 0.27, 0.31 and 0.32 per cent respectively.
For the country as a whole, the 3-year-average renewal totalled 0.57 per cent per year, thus slightly lower than the single 2015 estimate of 0.62 per cent.
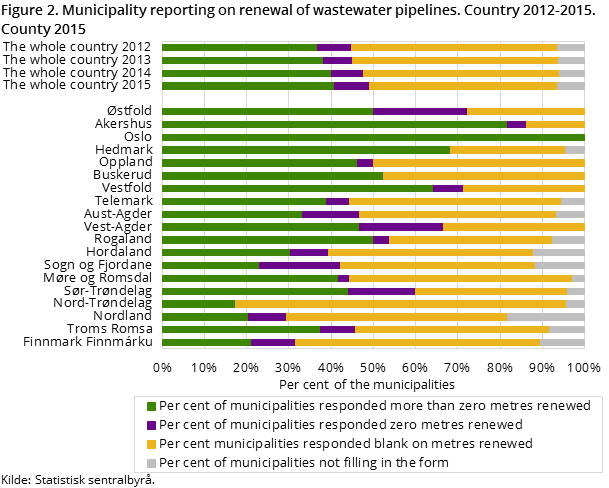
In 2015, 44 per cent of 401 reporting municipalities reported that they had renewed at least part of the sewage pipeline system, 9 per cent specified zero renewal and the remainder did not respond to that particular question. Corresponding figures on installation of new pipelines were 50 and 21 per cent of the municipalities respectively. In addition to the 401 municipalities above, there were also 27 municipalities that not submitted the form (“missing respondents”).
Akershus and Rogaland have the longest pipeline system
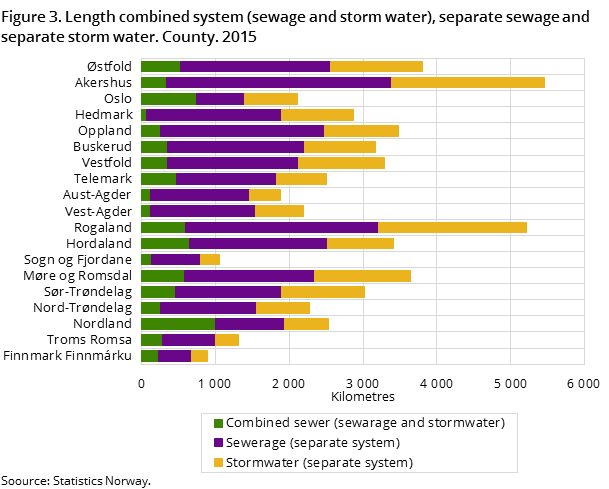
Estimations for 2015 show that there were around 36 800 kilometres of municipal sewage pipelines in the whole country (not including separate storm water pipelines), which equals approximately 92 per cent of the circumference of the earth at the equator. The sewage pipelines can be broken down into 7 500 kilometres of combined sewage and storm water and 29 300 kilometres of a separate sewage system.
In addition to the 36 800 kilometres of sewage systems, there are an additional 17 300 kilometres of separate storm water pipelines; in total around 54 100 kilometres of municipal wastewater pipelines in Norway.
The municipalities in the counties of Akershus and Rogaland have the longest wastewater pipeline systems, while Oslo and counties in Nordland have the largest percentage of combined sewer systems.
Sewage entering places it doesn’t belong
An estimated 1 800 sewage overflows have taken place throughout the country in 2015. This corresponds to 48 sewage overflows per thousand kilometres of municipal pipeline system – a 8 per cent decrease compared to 2014. Sewage overflows may lead to wastewater flowing to the storm water pipeline system and out to recipients or causing damage to buildings or other types of infrastructure.
Furthermore, the municipalities have accepted liability to around 340 closed cases of basement flooding in 2015.
Several wastewater facilities not complying with treatment permits
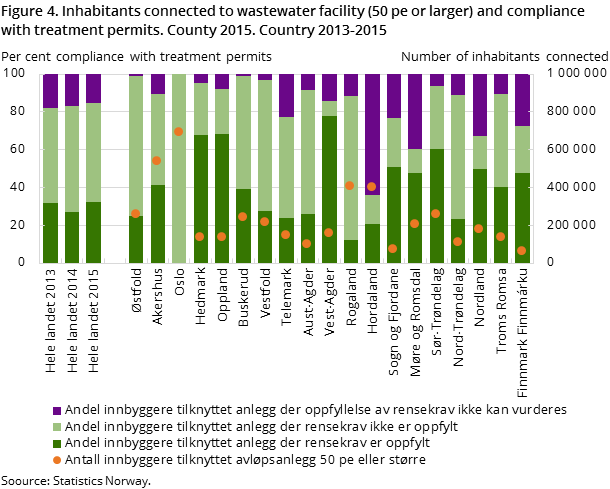
Several wastewater treatment plants – both large and small – are not complying with their treatment permits. In 2015, the statistics show that only 32 per cent of the inhabitants were connected to municipal wastewater facilities which complied with their treatment permits. This is up 5 percentage points compared to 2014. Around half of the total inhabitant connection belongs to wastewater facilities where treatment permits are not complied with. Simultaneously, there is also a large remaining share of around 15 per cent where compliance is unknown due to lack of reporting of permits and/or corresponding discharges.
The purpose with treatment permits is to prevent unwanted effects on the natural environment that receives treated wastewater from the wastewater facilities. Treatment permits are issued by the authorities, and are adjusted to the receiving water recipient and its sensitivity to pollution. The strictest permits are therefore to be found in areas where pollution loads are already high.
The most common non-compliance is found in relation to phosphorous permits. This is however not surprising since many wastewater facilities have a permit for the discharge of phosphorous. Many facilities also have permits on mechanical treatment, but these facilities are normally smaller in size and less prone to non-compliance.
85 per cent connected to municipal wastewater facilities
For 2015, it has been estimated that slightly less than 85 per cent of inhabitants are connected to municipal wastewater facilities of 50 population equivalents (pe) or more. Private solutions are most common among wastewater facilities of less than 50 pe.
Income from fees and fee calculation basis almost equal
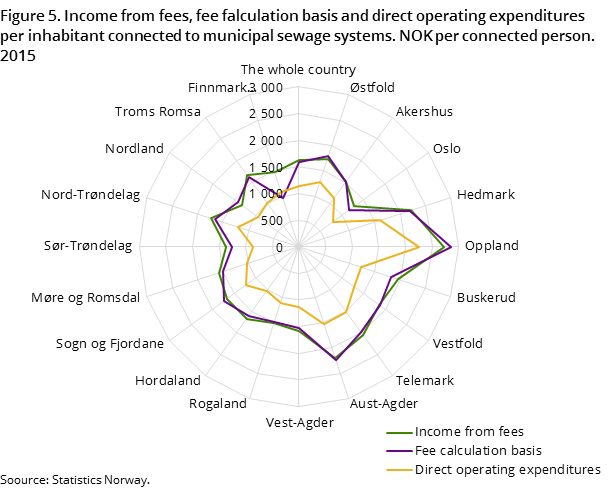
In 2015, the fee calculation basis was NOK 1 590 per inhabitant, and the income from fees was NOK 1 636 per inhabitant. This constitutes an increase of7 per cent in the income from fees compared to 2014, while fee calculation basis has been unchanged in the same time period.
Municipal costs in the wastewater sector are predominantly covered by fees paid by the users of the service. Regulations stipulate that fees in the municipal water and wastewater sector cannot exceed the municipalities’ actual costs for providing that particular service (“self cost”). Accurately stipulating income from fees to cover the real calculation basis in a single year is complicated, thus the municipalities are allowed to decide on fee levels so that income from fees over a five-year period equal the fee calculation basis.
Throughout the last five years, income from fees has increased by 25 per cent, while the fee calculation basis has increased by 23 per cent. In 2015, the income from fees was 3 per cent higher than the fee calculation basis, but overall, for the whole five-year-period 2011-15, the income from fees has been around 2 per cent higher than the fee calculation basis.
«»
What does «compliance with treatment permits» mean in these statistics?Open and readClose
The statistics do not address the extent of compliance – minor and major non-compliance are thus both categorised as “no compliance”. The calculations also contain some simplified assumptions, and thus the published statistics are attributed a certain level of uncertainty (see also About the statistics).
The overview also covers only facilities of 50 person equivalents (pe) or more, i.e. small separate wastewater facilities are not included.
The statistics is now published as Municipal wastewater.
Contact
-
Gisle Berge
E-mail: gisle.berge@ssb.no
tel.: (+47) 48 12 19 97
