Content
Published:
This is an archived release.
0.52 per cent of sewage system renewed
In 2012, 186 out of the 35 900 kilometres of the existing sewage pipeline system was renewed, representing 0.52 per cent. Installation of new wastewater pipelines constitute 350 kilometres during the same time period, thus at a significantly quicker rate than renewal itself.
| 2008 | 2011 | 2012 | Change in per cent | ||
|---|---|---|---|---|---|
| 2008 - 2012 | 2011 - 2012 | ||||
| Percentage of population connected to municipal wastewater facilities | 83.4 | 84.1 | 83.9 | 0.6 | -0.2 |
| Connection density of wastewater pipeline system (inhabitants/km) | 114 | 117 | 118 | 3.5 | 0.9 |
| Percentage of total wastewater pipeline system renewed, 3-year-average | .. | 0.46 | 0.48 | .. | 4.3 |
| Number of sewage overflow in sewage pipelines and manhole covers per km pipeline | 0.079 | 0.067 | 0.054 | -31.6 | -19.4 |
| Income from fees per inhabitant connected to municipal wastewater facilities | 1 236 | 1 376 | 1 429 | 15.6 | 3.9 |
| Operating expenditures per inhabitant connected to municipal wastewater facilities | 853 | 940 | 988 | 15.8 | 5.1 |
Unless renewal rates increase, aging wastewater pipelines throughout the municipalities will be the unavoidable result. Even without new installations it will take more than 200 years to renew the whole pipeline system with the current renewal rate.
Highest renewal rates in Oslo, Hordaland and Akershus
Renewals tend to vary from one year to another. The key figure “Percentage of total sewage pipeline system renewed, 3-year average” will even out these cyclical variations.
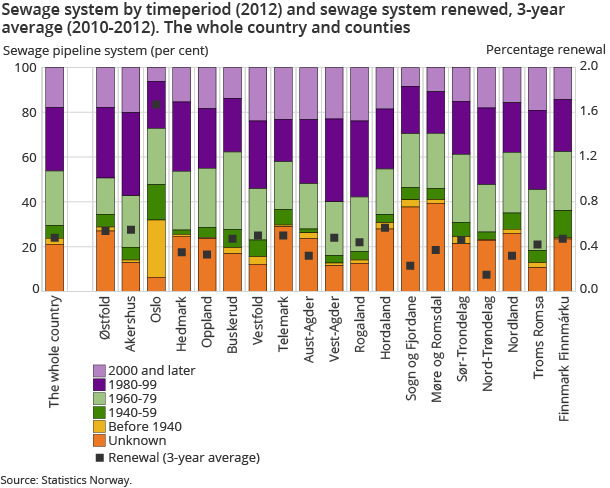
For the 3-year period 2010-2012, the municipalities in the counties of Oslo, Hordaland and Akershus saw the most renewals at respectively 1.67 per cent, 0.57 per cent and 0.55 per cent, while Nord-Trøndelag and Sogn og Fjordane renewed the least, respectively 0.15 per cent and 0.23 per cent.
For the country as a whole, the 3-year-average renewal totalled to 0.48 per cent, thus slightly lower than the single 2012-estimate of 0.52 per cent.
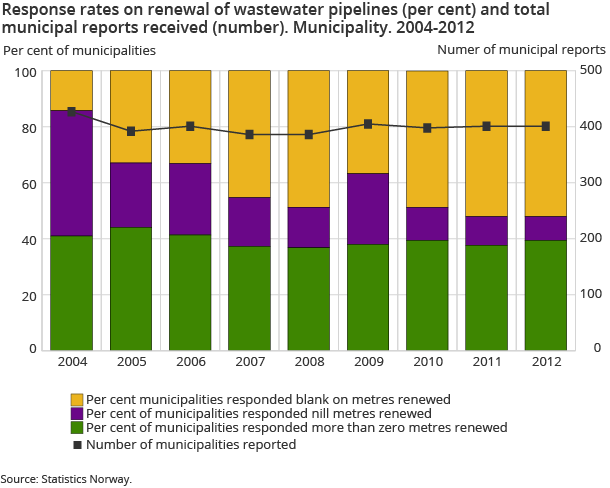
In 2012, 39 per cent of 401 reporting municipalities (429 in total) reported that they had renewed at least part of the sewage pipeline system, 9 per cent specified zero renewal and the remaining were non-respondents to that particular question. Corresponding figures on installation of new pipelines were 49 and 20 per cent of the municipalities respectively.
The renewal of sewage pipelines is of critical importance to prevent damage to buildings and pollution through leakages. Leaking sewage pipelines can also contribute to higher treatment costs as surface water and groundwater can enter the pipelines.
Akershus and Rogaland have the longest sewage system
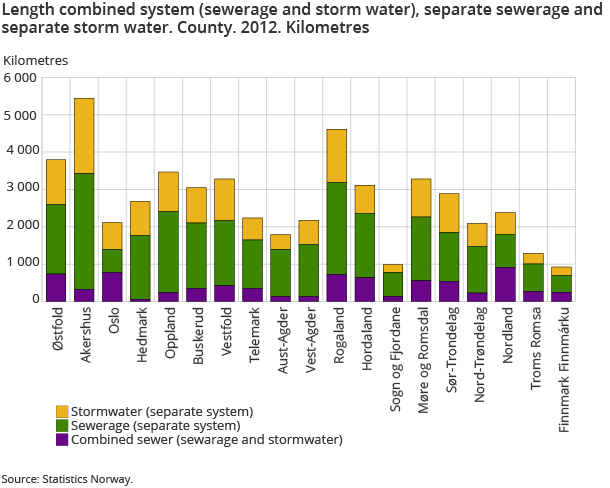
Estimations for 2012 show that there were around 35 900 kilometres of municipal sewage pipelines in the whole country (not including separate storm water pipelines), which equals approximately 90 per cent of the circumference of the earth at the equator. The sewage pipelines can be divided into 7 800 kilometres of combined sewage and storm water and 28 100 kilometres of a separate sewage system. The municipalities in the counties of Akershus and Rogaland hold the longest sewage system, while counties in Oslo and Nordland have the largest share of combined sewer systems.
In addition to the 35 900 kilometres of sewage systems, there are an additional 15 700 kilometres of separate storm water pipelines; in total around 51 600 kilometres of municipal wastewater pipelines in Norway.
30 years old pipeline system
The exact age of municipal wastewater pipelines will normally differ across regions – also within a single municipality – but for the country as a whole, it has been estimated at around 30 years old (38 years when adjusted for pipelines laid down in an unknown period). Around 2.7 per cent of the municipal wastewater pipelines were installed before 1940, while 46 per cent were installed in 1980 or later.
In 2012, the renewal rates were the highest for the oldest part of the sewage system, with 0.57 per cent renewal for the pipelines laid before 1940 and 0.92 per cent in unknown period. By comparison, there was a 0.15 per cent renewal of sewage pipelines installed in 2000 or later.
One pumping station every four kilometres
Pumping stations are sometimes used to direct wastewater against gravity (uphill etc). For 2012, it has been estimated that there are around 9 200 municipal-owned pumping stations in Norway; an average density of 0.26 pumping stations per kilometre.
Variation in standard of sewerage pipeline systems
An estimated 1 900 sewage overflows have taken place throughout the country in 2012. This corresponds to 54 sewage overflows per thousand kilometre of municipal pipeline system – a 19 per cent decrease compared to 2011.
Furthermore, the municipalities have accepted liability to around 310 closed cases of basement flooding in 2012.
84 per cent of inhabitants connected to municipal wastewater facilities
For 2012, it has been estimated that slightly less than 84 per cent of inhabitants are connected to municipal wastewater facilities of 50 person equivalents (pe) or more. Private solutions are most common among wastewater facilities of less than 50 pe.
Income from fees and fee calculation basis almost equal
In 2012, the fee calculation basis was NOK 1 389 per inhabitant, and the income from fees was NOK 1 429 per inhabitant. This constitutes an increase of 2.4 and 3.7 per cent respectively compared to 2011.
Municipal costs in the wastewater sector are predominantly covered by fees paid by the users of the service. Regulations stipulate that fees in the municipal water and wastewater sector cannot exceed the municipality’s actual costs for providing that particular service (“self cost”). Accurately stipulating income from fees to cover the real calculation basis in a single year is complicated, thus the municipalities are allowed to decide on fee levels so that income from fees over a five-year period equal the fee calculation basis.
Throughout the last five years, income from fees has increased by 13.5 per cent, while the fee calculation basis has only increased by 4.8 per cent. In 2008 the income from fees was 7 per cent less compared to the fee calculation basis, but overall, for the whole five-year-period, this has evened out. The total of income from fees and fee calculation basis for 2008-12 is almost equal, with income from fees a slight 0.3 per cent higher than fee calculation basis.
The statistics is now published as Municipal wastewater.
Contact
-
Gisle Berge
E-mail: gisle.berge@ssb.no
tel.: (+47) 48 12 19 97


