Content
Published:
This is an archived release.
Sulphur emissions reduced by 9 per cent
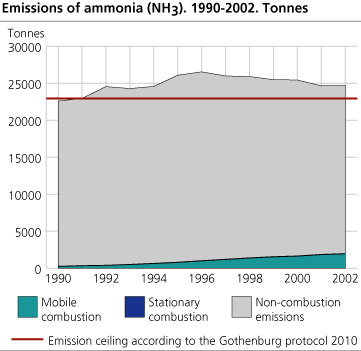
Norwegian emissions of sulphur dioxide were reduced by 9 per cent in 2002, compared with the year before. The decrease is mainly due to lower activity in parts of the manufacturing industries and not to long-term environmental measures. Emissions of ammonia were at the same level in 2002 as in 2001.
In 1999, Norway signed the Gothenburg protocol on reduction of long-range transboundary emissions in Europe. In this protocol, Norway has committed itself to reduce emissions of sulphur dioxide in 2010 to 22 000 tonnes, which is a reduction of 58 per cent compared to the level in 1990. Emissions of ammonia in 2010 should not be higher than 23 000 tonnes, which equals the level in 1990.
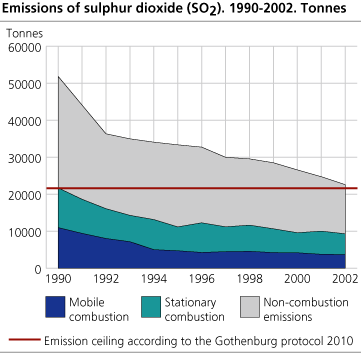
Norwegian emissions of sulphur dioxide were approximately 22 600 tonnes in 2002, which is a little more than 2 000 tonnes less than the preceding year, according to preliminary calculations from Statistics Norway and the Norwegian Pollution Control Authority. If the decrease continues, Norway may reach the limit in the Gothenburg protocol already in 2003. It is, however, uncertain if the decrease will continue in 2003. The reduction in 2002 was mainly due to reduced activity in parts of the manufacturing industries, not to long-term environmental measures. Future increased production may lead to higher emissions, unless other measures are introduced. Sales of light and heavy fuel oils and other petroleum products are increasing: In the 12 months period ending in May 2003, sales were 2,9 higher than the previous 12 months period. From January to May 2003, sales were 7.1 per cent higher than in the same period in 2002. Accordingly, if the sulphur contents in the products remain unchanged, emissions to air from combustion of these products will increase somewhat in 2003.
| Emission ceiling 2010 according to the Gothenburg Protocol. Status 2002. Tonnes (per cent) |
| Component | Emissions 1990 | Emissions 2002 | Emission ceiling 2010 | Necessary reduction 2002-2010 | |||||||||||||||||||||||||||||||||||
|---|---|---|---|---|---|---|---|---|---|---|---|---|---|---|---|---|---|---|---|---|---|---|---|---|---|---|---|---|---|---|---|---|---|---|---|---|---|---|---|
| Sulphur dioxide (SO2) | 51 883 | 22 607 | 22 000 | 607 tonnes (3 per cent) | |||||||||||||||||||||||||||||||||||
| Ammonia (NH3) | 22 589 | 24 712 | 23 000 | 1 712 tonnes (7 per cent) | |||||||||||||||||||||||||||||||||||
Manufacturing industries have the highest emissions...
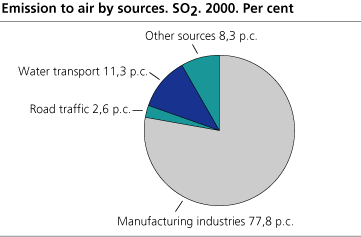
Manufacturing industries are responsible for three quarters of Norwegian SO2 emissions to air. 64 per cent of the emissions in 2000 came from different industrial processes, such as production of ferroalloys and aluminium, while 14 per cent were due to industrial combustion. 11 per cent came from domestic shipping and fishing and 2 and 3 per cent, respectively, from heating of dwellings and road traffic. The rest of the emissions (6 per cent) were due to combustion in air transport, oil and gas activities on the continental shelf and other industries. Emissions from international air and sea transport are not included in the Gothenburg protocol. International air transport causes only minor emissions of SO2.
...but also the largest reductions in 2002
At the same time, most of the decrease in the national SO2 emissions in 2002 was caused by the manufacturing industries, which reduced the emissions from stationary combustion by 2 100 tonnes from the preceding year. The decrease is due to lower activity and closing down in the ferroalloy industry, closing down of the magnesium production and introduction of some minor environmental measures. The latter include improved cleansing at some plants, use of coal and coke with somewhat lower sulphur content and lower sulphur contents in heavy and light fuel oils.
Emissions from road traffic increased somewhat for the first time since 1994 because of more use of auto diesel and higher sulphur content in petrol than the year before. However, the sulphur content in auto diesel was lower and the use of petrol decreased, compared to 2001.
Emissions of SO2 differ from, e.g., CO2 emissions in the possibility of reductions through technical measures. Norwegian SO2 emissions have been reduced because of more cleansing of emissions from the manufacturing industries, switchover from use of fossil fuels to electricity, use of lighter oil products and reduced sulphur contents in oil products and reducing agents. The introduction of an extra tax on auto diesel with high sulphur content (more than 0.005 per cent) has also proved to be efficient, as the oil companies quickly reduced the sulphur content after the tax introduction in January 2000.
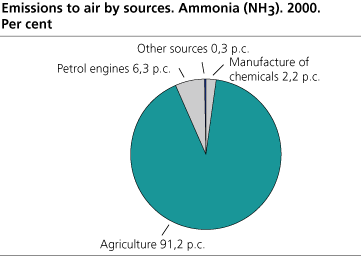
90 per cent of ammonia emissions from agriculture
Emissions of ammonia were unchanged in 2002, compared to the year before. These emissions are, like the SO2 emissions, just above the demand in the Gothenburg protocol. Agriculture was responsible for more than 90 per cent of Norwegian ammonia emissions in 2000. The emissions are caused by domestic animals, use of commercial fertilizer and ammonia treatment of straw. The remainder of the emissions comes mainly from road traffic (6 per cent) and production of fertilizer (2 per cent).
In 2002, a minor decrease in emissions of ammonia from agriculture was outweighed by an increase in emissions from road traffic. Ammonia is created as a by-product in the cleansing process in catalytic converters in petrol vehicles. The increase is due to a continued growth in the share of cars with catalytic converters. There were also higher emissions from diesel vehicles, because of increased use of auto diesel.
Earlier this year, Statistics Norway and the Norwegian Pollution Control Authority published figures on the other gases included in the Gothenburg protocol. Read more about this here: Emissions of NOX , NMVOC and ammonia. Preliminary figures for Norway, 2002 .
Tables in StatBank .
More articles on air pollution and greenhouse gases
Emissions to air of greenhouse gases. Preliminary national figures, 2002
Emissions of NOX and NMVOC. Preliminary figures for Norway, 2002
Emission to air of persistent organic pollutants and heavy metals, 1990-2001
The statistics is published with Emissions to air.
Contact
-
Statistics Norway's Information Centre
E-mail: informasjon@ssb.no
tel.: (+47) 21 09 46 42