Content
Published:
This is an archived release.
Less construction activity in Norway’s coastal zone
The 100-metre belt along the Norwegian shore is becoming less accessible, but at a lower rate than before. Land use changes have declined since 2009 due to less construction activity. The shore along the Oslo Fjord has the largest land use changes and the lowest percentage of accessible coast.
| 2005 | 2010 | 2014 | 2015 | |
|---|---|---|---|---|
| Areas influenced by buildings, railways, roads and agricultural land | 1 250 730 | 1 277 001 | 1 291 303 | 1 294 420 |
| Potentially accessible coastal area | 2 893 314 | 2 867 043 | 2 852 741 | 2 849 624 |
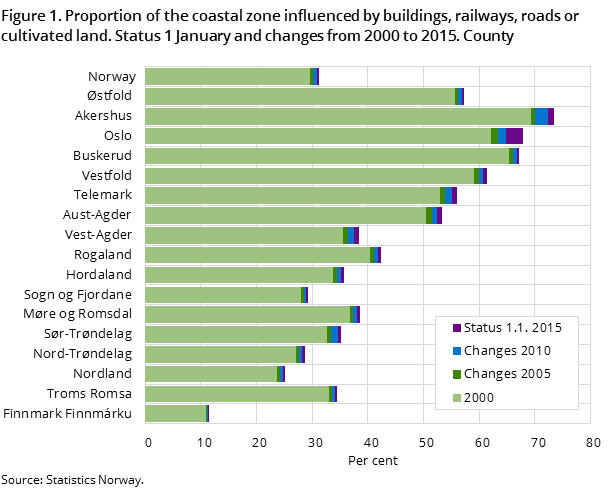
Nearly a third of Norway’s coastal area is affected by human intervention and is therefore regarded as not accessible. This mainly includes areas affected by buildings, but also agricultural land, roads and train lines. In order to protect the coastal zone and to reduce construction pressure, the government issued new planning guidelines in 2011. As a consequence, building activity in the coastal zone declined in most counties.
Coast along Oslo Fjord under most construction pressure
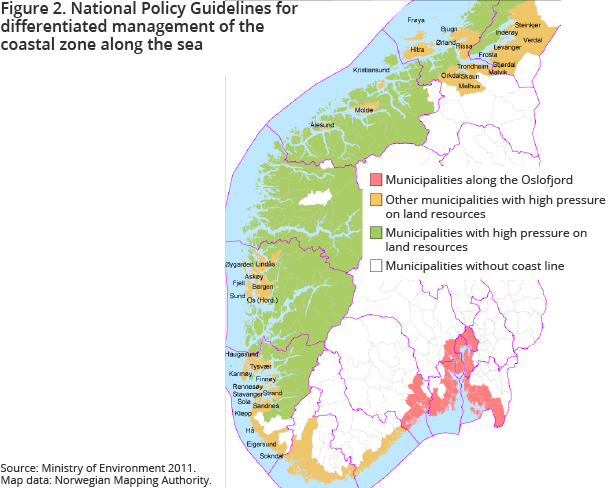
The construction pressure along the Norwegian coast is variable. In order to ensure that coastal management takes local and regional circumstances into account, the authorities established three different regions that reflect the degree of construction pressure:
- the region around the Oslo Fjord
- other areas with high construction pressure
- areas with low construction pressure.
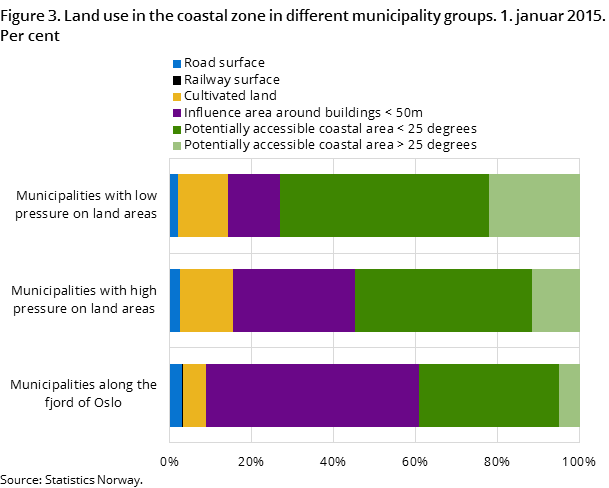
Construction pressure is highest in the counties along the Oslo Fjord. Between Østfold and Telemark only 40 per cent of the coastal zone area is accessible, while more than half of the costal zone area is affected by buildings. The west coast shows much less construction pressure: three quarters of the coastal zone area is accessible. However, nearly a third of this is regarded as being too steep for outdoor activity.
When looking at a more local level, it is evident that the municipalities around the inner Oslo Fjord have the lowest percentage of accessible coastal zone. In Akershus, three quarters of the area in the 100-meter belt is affected by human impact, and the corresponding share in Oslo is two thirds. Consequently, only 2 square metres of coast are available per inhabitant in Oslo, compared to 15 square metres in Akershus.
Accessible coast is shrinking less than before
The accessible zone along the whole Norwegian coast decreased by 67 900 decares from 2000 to 2005. This corresponds to 1.6 per cent of the whole 100-meter belt or about 9 500 football pitches. Nevertheless, the accessible coastal area decreased less in all counties, except for Oslo. In Oslo, the inaccessible coastal zone increased by 2.9 per cent between 2010 and 2015. In the earlier time periods 2000-2005 and 2005-2010 the increase was just 1.5 per cent.
Number of new buildings is declining
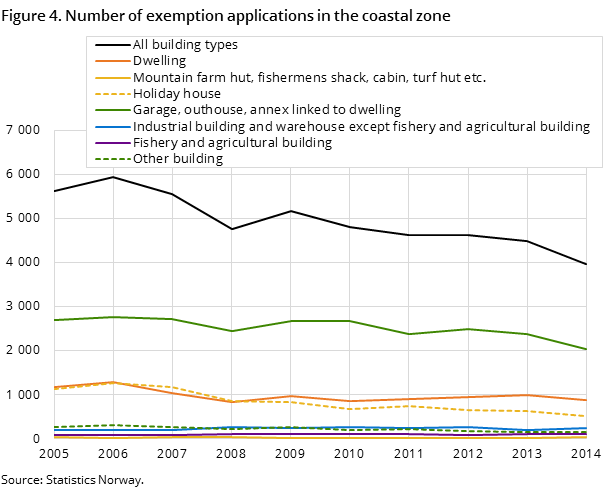
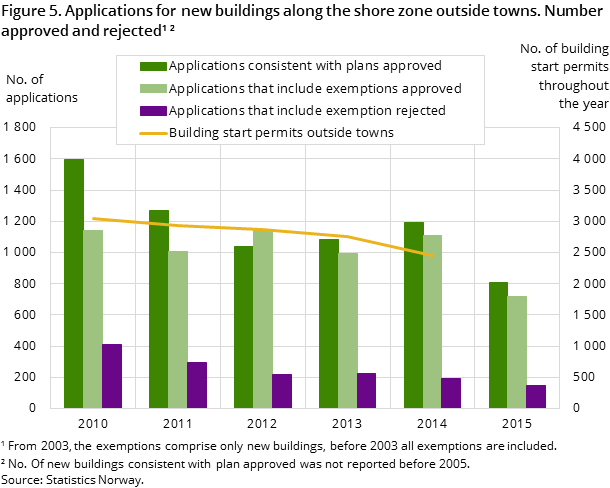
The main driving force behind land use change in the coastal zone is the construction of new buildings, but the number of new buildings has fallen, especially since 2013. This is a result of a strong decrease in building start permits in Hordaland, Møre og Romsdal and Nordland. All counties, except Østfold, Aust-Agder and Vest-Agder, granted fewer building start permits in 2015 than in 2014. According to the Norwegian Cadastre, nearly 4 000 building start permits were granted nationwide in 2015, a decline of 30 per cent compared to 2005. 2 400 of these building permits were given outside urban areas.
The decline in new buildings is observed for all building types, except for dwellings. The amount of new dwellings was at the same level as holiday houses until 2009. Since then, the number of new holiday houses has fallen, while the number of new dwellings has remained stable at a higher level.
Mostly holiday houses built outside urban areas
Two thirds of new buildings in the 100-metre belt are built outside urban areas. Over the last couple of years it has been observed that more holiday houses than dwellings have been built outside urban areas. However, in 2015 the number of new dwellings increased to about the same level as holiday houses.
Calculations based on KOSTRA show that the coastal municipalities received nearly 900 exemption applications for new buildings in 2015. This corresponds to a 33 per cent decrease compared to 2014. The municipalities granted 83 per cent of these applications. This share has been stable between 80 and 85 per cent since 2012.
Reduction in building activity along watercourses
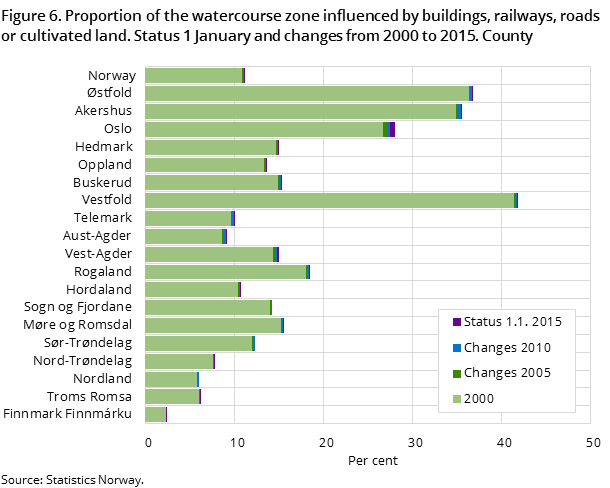
A tenth of the Norwegian watercourse zone area is regarded as inaccessible. The building activity follows the same trend as in the coastal zone: accessibility is declining, but at a slower rate.
The area of accessible watercourse zone is decreasing most in Oslo, Akershus and Vest-Agder. Human intervention is largest in Vestfold, where over 40 per cent of the watercourse zone area is inaccessible. This is because a third of Vestfold’s watercourse zone is agricultural land, and only about 7.5 per cent is affected by buildings.
Building activity has declined since 2006, especially since 2013, showing a similar trend to that observed for the coastal zone. There were nearly 3 000 building permits issued in 2015, which is a 25 per cent drop from 2006. In July 2009, a new Planning and Building Act came into force, with a section relating to a construction ban along water courses. This ban may have contributed to a decrease in the reduction of land use pressure in the watercourse zone.
Registered building permissions and building statisticsOpen and readClose
Figures for buildings in the building statistics rely on dates for when permits are registered by the municipality in the Cadastre (Matrikkelen). A building permit does not always mean that construction will be started at once.
Due to delays in the registration of building start permits from local authorities for 2015, national figures for 2015 are presented as preliminary. The figures in Statbank refer to the status as of 1 January of each year and include preliminary figures for 1 January 2016.
The statistics on buildings do not cover changes to dwellings caused by rebuilding of existing building stock (i.e. new dwellings due to reconstruction of utility floor space from industry to dwellings).
Estimates for land use changeOpen and readClose
Due to mass registration of base line data over crop land, road and rail in recent years, estimates of changes back in time do not necessarily show the real land use changes but improve the data quality. Figures for previous years for these land use categories are therefore based on figures for 1 January 2016.
Contact
-
Tom Anders Engebakken
E-mail: tom.engebakken@ssb.no
tel.: (+47) 47 46 47 66
-
Jørn Kristian Undelstvedt
E-mail: jorn.kristian.undelstvedt@ssb.no
tel.: (+47) 94 50 68 64
