Content
Published:
This is an archived release.
Publicly accessible shore zone is shrinking
The main driving force behind land use changes in the coastal zone is construction. In 2013, the land use change decreased in the coastal zone as a result of reduced construction activity. Despite a reduction in construction activity, the shrinking of the publicly accessible coastal zone continued.
| 2005 | 2010 | 2013 | 2014 | |
|---|---|---|---|---|
| Areas influenced by buildings, railways, roads and agricultural land | 1 251 044 | 1 278 069 | 1 289 601 | 1 292 489 |
| Potentially accessible coastal area | 2 893 004 | 2 865 979 | 2 854 447 | 2 851 559 |
Fewer building start permits for construction were granted in the Norwegian coastal zone in the period 2000-2014. The registrations in the Norwegian Cadastre show that 4 530 building start permits were granted in 2013, compared to nearly 5 600 in 2005. This is a decline of almost 20 per cent from 2005 to 2013. The decline can partly be explained by fewer permits issued in the county of Hordaland. In 2013, 863 permits were granted compared to 1 127 in 2009 in Hordaland.
More residential buildings in the coastal zone
There has been a decline in the number of building start permits for most building types in the coastal zone. The only exception is residential buildings, which is at a higher level than in 2010. In 2010, 846 permits of residential buildings were granted, compared to 969 in 2013. Residential buildings accounted for nearly a quarter of all permits in 2013, but the most common building type was garages and outhouses, which comprised 42 per cent of the building start permits.
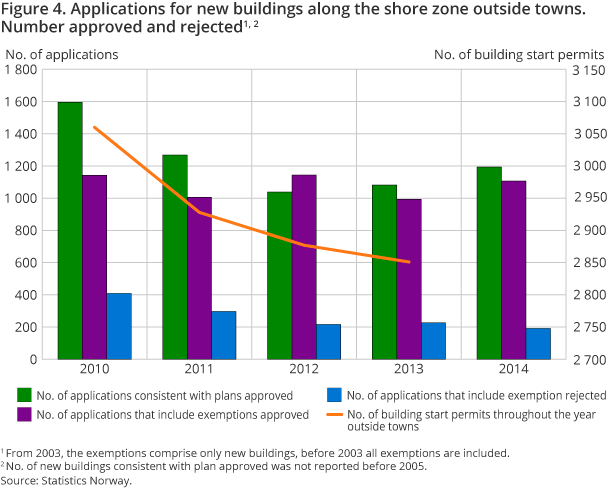
Most building start permits within a 100-metre belt were given to areas outside towns, i.e. in sparsely populated areas. In 2013, 2 850 permits were granted, compared to 3 060 in 2010. Holiday homes are the most common building types in the coastal zone outside towns.
Calculations based on the KOSTRA reporting for the period 2010-2013 show that the municipalities received and granted a gradually falling number of exemption applications for new buildings in the coastal zone. The number of applications decreased from 1 550 to 1 220 during this period, which also follows developments in construction activity.
Land use change reduces the opportunities for outdoor recreation
Construction activity is the main driving force behind land use changes in the coastal zone. In order to reduce the construction pressure on the coastal zone, the government issued planning guidelines in 2011.
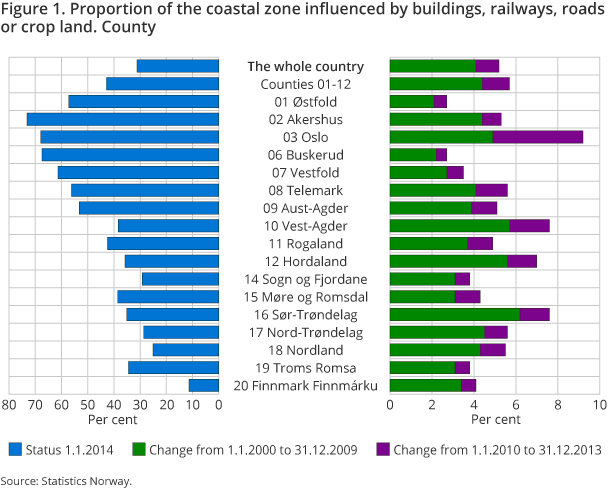
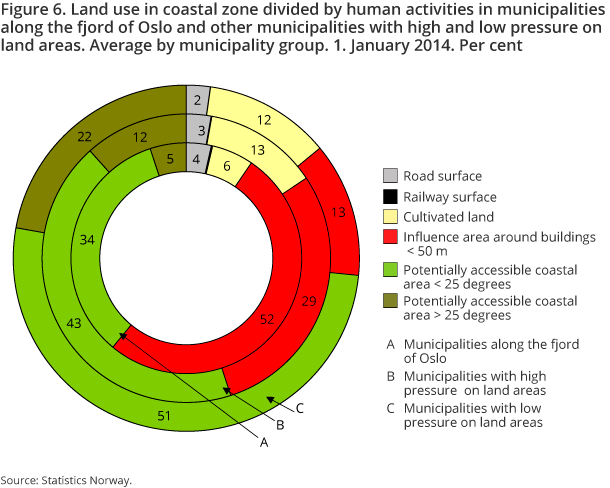
The areas not affected by human intervention are considered to be potentially accessible for outdoor activities. Despite a reduction in construction activity, the area that is potentially accessible for outdoor activities is still shrinking. In addition to areas influenced by buildings (<50 metres from buildings), railways, roads and agricultural land are also regarded as areas that are not potentially accessible for outdoor activities. Statistics Norway is now working on better time series of land use changes in order to get a better picture of historical changes. The current situation shows that 31.2 per cent of Norway's coastal zone at the start of 2014 was affected by human intervention. For an overview of the potentially available areas see kart.ssb.no.
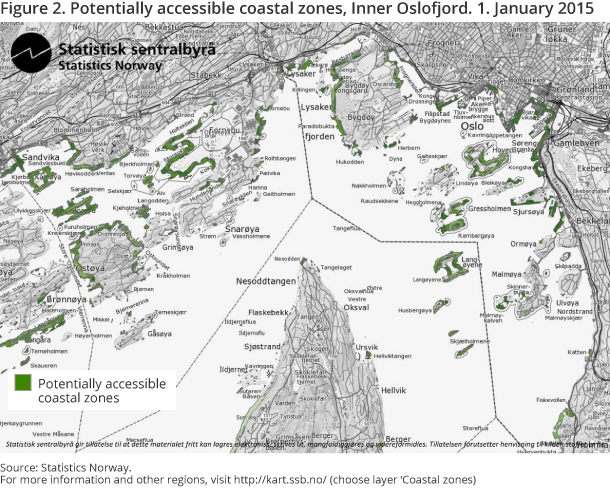
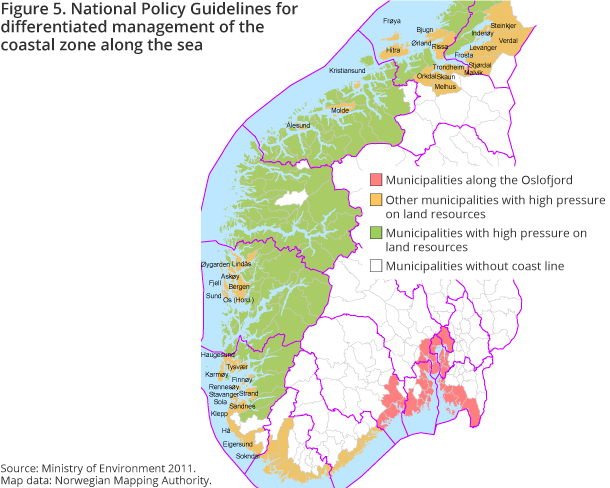
On a local level, the inner parts of the Oslo fjord have the least potentially accessible coastal zone (on the mainland) compared to the average at national level. Seventy-three per cent of Akershus coastal zone are affected by buildings, rail, road or cropland, and 68 per cent of Oslo is affected. For Oslo, these land use changes resulted in only 2 square metres of the “not too steep coastal zone” being potentially publicly accessible per inhabitant in the municipality.
Reduction in building activity in the watercourse zones
Construction activities in the watercourse zone increased until 2006, after which the trend changed. In 2006, 4 013 building start permits were granted, while in 2013 only 3 264 permits were granted. The statistics only comprise larger water courses.
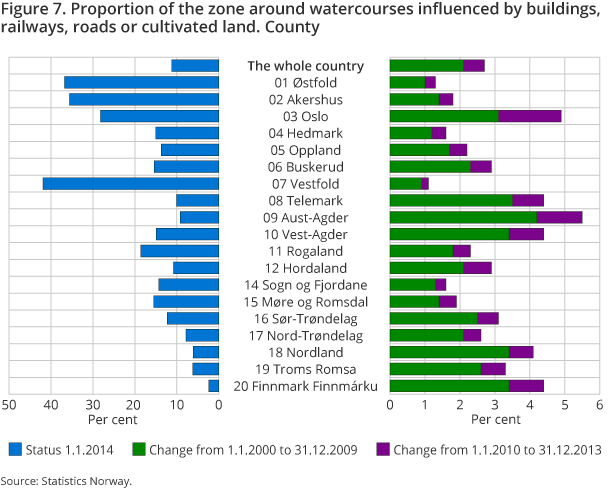
As for the coastal zone, the watercourse zone is more affected by human intervention in the Oslofjord region compared to other parts of the country. The land use pressure is greatest in Vestfold, where 42 per cent of the watercourse zone was influenced by buildings, railways, roads or crop land at the start of 2014. In July 2009, a new Planning and Building Act came into force, with a section relating to a construction ban along water courses. This ban may have contributed to a decrease in the reduction of land use pressure in the water course zone. For most counties, the change was less than one per cent, apart from Oslo, where the proportion of watercourse zone affected by buildings, rail, road or cropland increased by almost 2 per cent in the period 2010-2014. See Planning and Building Act.
Estimates for land use changeOpen and readClose
Due to mass registration of base line data over crop land, road and rail in recent years, estimates of changes back in time do not necessarily show the real land use changes but improve the data quality. Figures for previous years for these land use categories are therefore based on figures for 31.12.2014 .
Registered building permissions and building statisticsOpen and readClose
Figures for buildings in the building statistics rely on dates for when permits are registered by the municipality in the Cadastre (Matrikkelen). A building permit does not always mean that construction will be started at once.
The statistics on buildings do not cover changes to dwellings caused by rebuilding of existing building stock (i.e. new dwellings due to reconstruction of utility floor space from industry to dwellings).
Contact
-
Tom Anders Engebakken
E-mail: tom.engebakken@ssb.no
tel.: (+47) 47 46 47 66
-
Jørn Kristian Undelstvedt
E-mail: jorn.kristian.undelstvedt@ssb.no
tel.: (+47) 94 50 68 64
