Content
Published:
This is an archived release.
Continued growth in sewage and sanitation
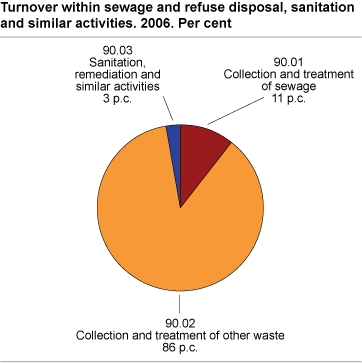
The 926 local-kind-of activity-units (KAUs) involved in sewage and refuse disposal and similar activities had a turnover of NOK 11.4 billion in 2006. The number of persons employed rose by 1.6 per sent to 6 255, while the total compensation of employees amounted to NOK 2.4 billion.
Collection and treatment of other waste
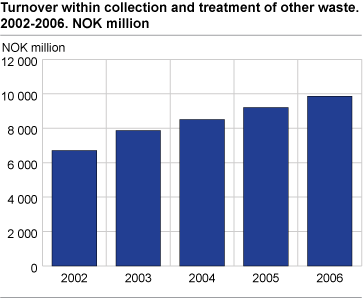
The 422 local KAUs involved in the collection and treatment of other waste had a turnover of NOK 9.9 billion in 2006, an increase of 7.2 per cent. This industry class employed 5 069 persons, approximately the same level as in 2005. The compensation of employees was NOK 2.0 billion, an increase of 3.3 per sent.
Collection and treatment of sewage
The 144 local KAUs involved in the collection and treatment of sewage had a total turnover of NOK 1.2 billion in 2006. 848 persons were employed in this industry class.
Sanitation, remediation and similar activities
The local KAUs within sanitation, remediation and similar activities employed 338 persons and had a turnover of NOK 288 million in 2006. The number of local KAUs was 360.
Statistics on enterprise levelThe structural business statistics for construction are compiled on local KAU level and on enterprise level. The figures on enterprise level may differ from figures on local KAU level. This is due to some enterprises being registered in one industry group according to main activity, while at the same time consisting of local KAUs in other groups. |
Tables:
- Table 1 Sewage and refuse disposal, sanitation and similar activities. Principal figures, by industry class. Local kind-of-activity units. 2005 and 2006
- Table 2 Sewage and refuse disposal, sanitation and similar activities. Principal figures, by number of persons employed. Local kind-of-activity units. 2006
- Table 3 Sewage and refuse disposal, sanitation and similar activities. Principal figures, by region. Local kind-of-activity units. 2006
- Table 4 Sewage and refuse disposal, sanitation and similar activities. Principal figures, by industry class. Enterprises. 2005 and 2006
- Table 5 Sewage and refuse disposal, sanitation and similar activities. Principal figures, by number of persons employed. Enterprises. 2006
- Table 6 Sewage and refuse disposal, sanitation and similar activities. Gross Investments, by group of fixed assets and industry class. Enterprises. 2006
- Table 7 Sewage and refuse disposal, sanitation and similar activities. Gross Investments, by category and industry class. Enterprises. 2006
The statistics is now published as Business statistics.
Contact
-
Statistics Norway's Information Centre
E-mail: informasjon@ssb.no
tel.: (+47) 21 09 46 42