Content
Published:
This is an archived release.
Slight increase in hazardous waste
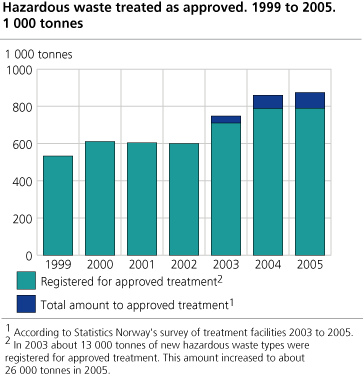
A total of 875 000 tonnes of waste harmful to human health and the environment were treated by approved means in 2005, a rise of 2 per cent from the year before. Furthermore, about 64 000 tonnes were handled in unknown ways, and parts may have ended up in the nature.
Norwegian facilities treated 809 000 of the 875 000 tonnes, while 66 000 tonnes were exported. The figures for 2004 and 2003 have been reduced with respectively 6 and 5 percent since our last release, from 908 000 tonnes in 2004 and 782 000 tonnes in 2004.
2 per cent increase in approved treatment
Increasingly more hazardous waste has been sent for approved treatment the last years. However, from 2004 the amounts seem to stabilise. 875 000 tonnes of hazardous waste were delivered to approved treatment facilities in 2005, which is only 2 per cent more than the year before. The increase from 2003 is, however, as much as 17 per cent.
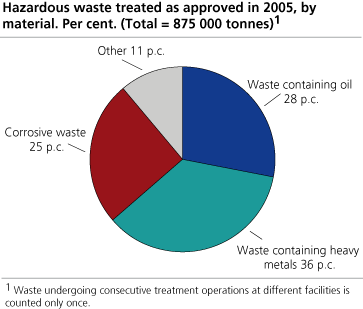
Waste containing heavy metals (mainly slag), corrosive waste and waste containing oil are the predominant waste types, as they have been since 1999. The manufacturing industries contributed with 67 and 98 per cent to the former two waste types, while the latter one mainly came from oil drilling and service industries (42 and 32 per cent respectively).
Less is treated in unknown ways
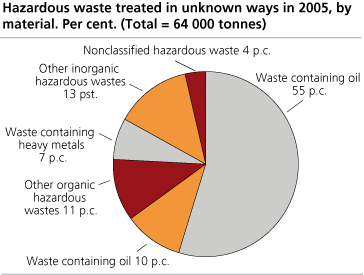
64 000 tonnes of hazardous waste were handled in unknown ways in 2005. This is 16 000 tonnes less than the previous year, but 4 per cent more than in 1999. The increase from 1999 is due to a reclassification of several waste types from non-hazardous to hazardous implemented 01.01.2003. By keeping these waste types apart, the trend shows a 22 per cent decrease, and this is mainly a result of increased collection of oil-containing slop water from 2004 to 2005.
Unknown handling may in part have been a result of lacking registration while handing in the waste. However, some of the waste may have been handled inappropriate or disposed of in the nature. The figures from Statistics Norway indicate that a substantial fraction of the unknown handling is actually due to lack of registration, and is thereby included in the 875 000 tonnes treated as approved.
Oil-containing waste was the main constituent of the waste handled in unknown ways, as has been the situation since 1999. However, the amount has decreased by 33 per cent since 2004, to 35 000 tonnes in 2005. Statistics Norway’s survey of treatment facilities indicates that this waste type in particular is underrepresented in the registers of hazardous waste delivered for approved treatment.
Of wastes containing PCBs, a substantial fraction is still handled in unknown ways, but the amount is decreasing. In 2005, about 1 000 tonnes were handled in unknown ways, which is 25 per cent less than in 2004 and as much as 71 per cent less than in 1999. 69 per cent of all PCB-containing waste was handed in to an approved collector in 2005.
86 per cent sent for disposal
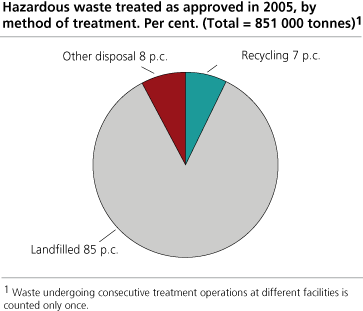
86 per cent of all hazardous waste entering approved treatment in 2005 was disposed of in specially engineered landfills or by other means. Most hazardous waste types are hard to recover, and this may explain the high share sent for disposal. A high proportion of the disposed waste are solids stabilised prior to disposal, and some is thereafter used for landscape restoring.
64 000 tonnes of hazardous waste were either recycled or energy recovered in 2005. This is half of the level in 2003. In 2005 energy recovery amounted to 68 per cent of these tonnes, of which 90 per cent was waste oil. 32 per cent was recycled, of which corrosive waste and waste containing heavy metals were predominant. Also, a small fraction of oil-containing waste was recycled.
Norway exported several hazardous waste types to recovery or to disposal operations not offered in Norway. 43 per cent of the exported waste was containing heavy metals, while 25 per cent contained solvents (including paints etc.). The remaining was in general corrosive waste, oil-containing waste and other organic hazardous waste types.
|
New hazardous waste types and new data sources
Since 1999 the amount of hazardous waste delivered for approved treatment has raised by 64 per cent, according to present data sources. However, in Statistics Norway’s opinion the real waste increase is somewhat slighter from at least two reasons. Firstly, the figures for 2003 onwards build on more complete data sources than previous years. Secondly, several waste types, as impregnated wood, were reclassified from non-hazardous to hazardous waste from 01.01.2003. Adjusted for these conditions, the increase in waste amounts from 1999 to 2005 was 43 per cent. In 2005 about 26 000 tonnes of new hazardous waste types were delivered to approved facilities, representing 3 per cent of the total amount. |
|
Evaluation of the figures
The new figures are compiled on the basis of administrative registers and Statistics Norway surveys of treatment facilities. The surveys indicate that some hazardous waste entering approved treatment is not covered by the registers, revealing that the total amount of hazardous waste being generated each year is higher than shown by previous estimations based on the registers. In 2005 this underreporting amounted to about 85 000 tonnes, maybe more. Some waste types show higher amounts in the registers than in the surveys. A reason may be that the same waste amount is allocated to different material category in the two data sources. Another explanation might be stock changes at the treatment plants. It must still be taken into account a slight underestimation of the hazardous waste amounts entering approved treatment in the survey as well. The split between disposal and recycling must be regarded as uncertain, as some waste types consist of a small fraction suitable for recycling and the rest being pure natural matters as gravel and water. These pure matters may in some cases have changed treatment category from a year to another. Compared to our previous release, revision of micro data from Statistics Norway’s surveys in 2003 has resulted in decreased amounts for approved treatment in 2004 and 2003. The decrease is 6 and 5 per cent respectively. |
Tables:
- Table 1 Hazardous waste registered for approved treatment 1999 - 2005 and total amount treated as approved 2003 - 2005. 1000 tonnes.
- Table 2 Hazardous waste treated as approved 1999 to 2005, by material. 1000 tonnes.
- Table 3 Hazardous waste to unknown handling 1999 to 2004, original and new types. 1000 tonnes.
- Table 4 Hazardous waste to unknown handling 1999 to 2005, by material. 1000 tonnes.
- Table 5 Hazardous waste treated as approved 2003 to 2005, by method of treatment. 1000 tonnes.
- Table 6 Hazardous waste treated as approved 1999 to 2005, by industry. 1000 tonnes.
Additional information
Approved treatment as applied in this article includes only hazardous waste generated in Norway (export is therefore included, while import is excluded).
Contact
-
Gisle Berge
E-mail: gisle.berge@ssb.no
tel.: (+47) 48 12 19 97
-
Terje Lorentzen Landsem
E-mail: terje.landsem@ssb.no
tel.: (+47) 98 84 31 39


