Content
Published:
This is an archived release.
Waste water and solid waste
Norwegian establishments spent NOK 3.5 billion on environmental protection in 2004. Most of it was spent on treatment of waste water and solid waste. There were also large investments in equipment for cleaner air.
2.8 of the 3.5 billion were current costs, and 0.7 were used for investments. This is about 4 per cent of these establishments' total gross investments and 1 per cent of their total current costs. Nevertheless, the figures should be used with caution, because the variation is high.
Waste water and solid waste dominate the total environmental expenditure
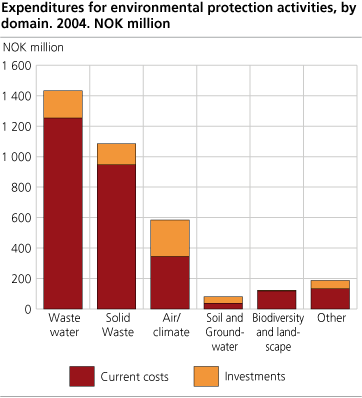
Most of the total environmental expenditures in 2004 were for activities related to waste water and solid waste. The expenditures for waste water and solid waste were 2.5 billion, or 72 per cent of the total environmental protection expenditures. The expenditures for these two environmental domains were dominated by current costs (87 per cent of the total environmental expenditures), while the investments were considerably lower (13 per cent of the total environmental expenditures). Also in previous years the reported figures show a clear domination of expenditures to waste water and solid waste.
Also activities for reduced air pollution and reduced climate gas emissions accounteded for a large share of the total expenditures for environmental protection activities, in effect 17 per cent. For these activities the levels of investments and current costs were about equally divided. Also for activities related to soil and ground water the costs were about equally divided, however the amounts spent were considerably lower. Biodiversity and landscape were dominated by the current cost expenditures, by 97 per cent of the total environmental expenditures for this domain.
Investments mostly for air and climate
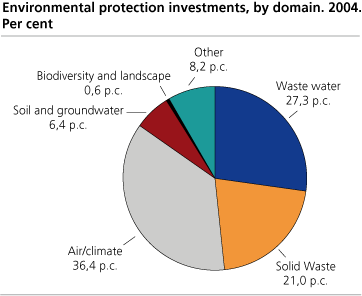
Activities related to air and climate accounted for the highest share of the investments. Waste water and solid waste had the second largest and the third largest share of the investments.
The figures show that Norwegian establishments made higher levels of investments in activities to treat pollution (end-of-pipe) rather than in activities to prevent pollution from arising (integrated technologies). 65 per cent of the reported investments were for pollution treatment measures (end-of-pipe). The remaining 35 per cent were pollution prevention measures, i.e. investments in cleaner technology in production processes that result in less pollution. However, the pollution treatment (end-of-pipe) investments are easier to identify and compute for establishments, and the actual figures for pollution prevention investments may be higher than reported.
Waste water and solid waste dominates current costs
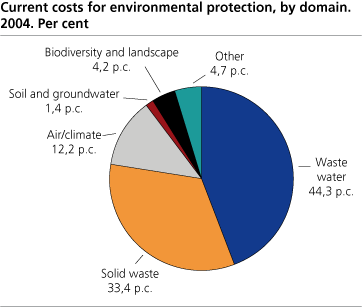
Waste water and solid waste were the domains with the highest level of current costs in 2004, and together they amounted to about 78 per cent of the current costs related to environmental protection activities. Also in previous years, the reported current costs were dominated by these two domains. Waste water and solid waste have also dominated the environmental protection expenditures in other nations.
Three industries dominate environmental protection expenditures
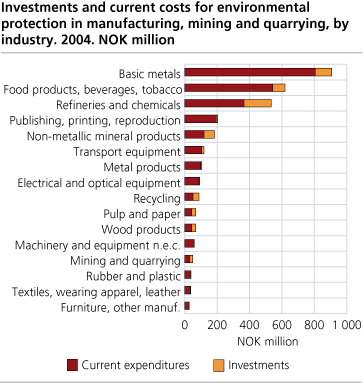
There were three industries with especially high expenses related to environmental protection activities. These industries were basic metals; food products, beverages and tobacco and refineries and chemicals. Basic metals, food products, beverages and tobacco and refineries and chemicals spent more than NOK 2.1 billion in environmental activities in 2004, which is 65 per cent of the environmental protection expenditures. Also in 2003, these industries reported particularly high expenditures for environmental activities.
The basic metals industry accounted for more than 28 per cent of the total environmental protection expenditures. Refineries and chemicals had the third largest share of the total environmental expenditures, but the largest share of 30 per cent of the investments.
For all industries, the current costs were higher than the investments.
The industry with the lowest level of expenditures was furniture, other manufacturing with about NOK 28 billion total environmental expenditures.
|
More about environmental protection expenditure statistics
The figures are based on a sample survey, and are grossed up to cover the entire manufacturing, mining and quarrying industries. The figures should be used with caution, because the variation is high. The oil and gas industry on the continental shelf is not included in the figures. The statistics are based on a sample survey including the 1 531 largest establishments in the manufacturing, mining and quarrying industries. The manufacturing industries with the highest expected levels of environmental protection investments are best represented in the sample. The figures should be used with caution, because the variation is high. Statistics for environmental protection expenditure are under development. The figures for 2002 and 2003 only cover a sample, dominated by establishments with more than 200 employees, and are not grossed up to cover the entire manufacturing, mining and quarry industries. During 2007, Statistics Norway wish to publish statistics that cover the entire manufacturing industry for 2002, 2003 and 2005. |
Tables:
Contact
-
Martin Lundeby Grimstad
E-mail: martin.grimstad@ssb.no
tel.: (+47) 90 66 47 43
-
Trine Heill Braathu Randen
E-mail: trine.heill.braathu.randen@ssb.no
tel.: (+47) 91 10 67 45


