Content
Published:
This is an archived release.
Emissions of hazardous substances still decreasing
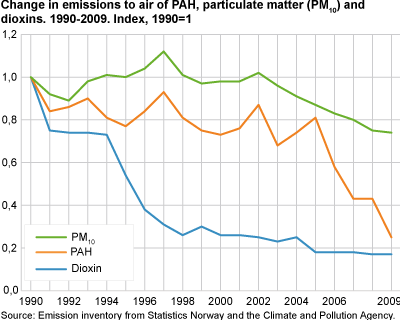
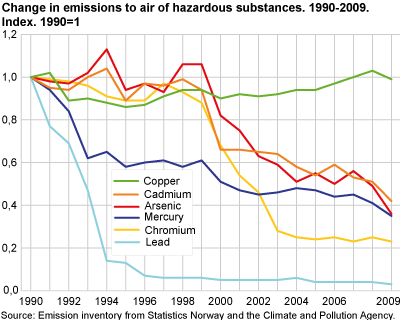
The emissions of heavy metals to air have been considerably reduced since 1990, in accordance with national targets and international obligations. In the period 2000 to 2007, the emissions were relatively stable, but have declined since 2007. Emissions of PAHs, particulate matter and dioxins are also decreasing.
The calculations of emissions to air for the period 1990-2009 are performed by Statistics Norway in close collaboration with the Climate and Pollution Agency.
Reduction in most emissions since 1990
Norway has a national target to reduce emissions compared with the emission levels in 1995. Internationally, we have an obligation to reduce emissions of selected hazardous substances compared with 1990. Emissions of PAHs have been reduced by three quarters since then, mainly due to reduced emissions from aluminium production. There has also been a positive trend in emissions of other hazardous substances, except for copper emissions, which are at the same level as in 1990.
The reduction in emissions continued from 2008 to 2009 for both heavy metals and dioxins, caused by lower activity in several industries. The time series for heavy metals have been revised for all years because of new calculations of emissions from use of anodes in the manufacture of aluminium. The results from these new calculations show higher emissions than previously reported from this industry.
| Unit | 2009 |
Per cent change
1990-2009 |
Per cent change
2008-2009 |
||||||||||||||||||||||||||||||||||||||||||||||||||||||||||||||||||||||||||||
|---|---|---|---|---|---|---|---|---|---|---|---|---|---|---|---|---|---|---|---|---|---|---|---|---|---|---|---|---|---|---|---|---|---|---|---|---|---|---|---|---|---|---|---|---|---|---|---|---|---|---|---|---|---|---|---|---|---|---|---|---|---|---|---|---|---|---|---|---|---|---|---|---|---|---|---|---|---|---|---|
| Lead | kg | 5 676 | -97 | -23 | |||||||||||||||||||||||||||||||||||||||||||||||||||||||||||||||||||||||||||
| Cadmium | kg | 490 | -58 | -18 | |||||||||||||||||||||||||||||||||||||||||||||||||||||||||||||||||||||||||||
| Mercury | kg | 513 | -65 | -15 | |||||||||||||||||||||||||||||||||||||||||||||||||||||||||||||||||||||||||||
| Arsenic | kg | 1 278 | -64 | -26 | |||||||||||||||||||||||||||||||||||||||||||||||||||||||||||||||||||||||||||
| Chromium | kg | 2 901 | -77 | -10 | |||||||||||||||||||||||||||||||||||||||||||||||||||||||||||||||||||||||||||
| Copper | kg | 22 864 | -1 | -3 | |||||||||||||||||||||||||||||||||||||||||||||||||||||||||||||||||||||||||||
| PAHs | kg | 76 569 | -75 | -42 | |||||||||||||||||||||||||||||||||||||||||||||||||||||||||||||||||||||||||||
| Dioxins | g | 21 | -83 | -3 | |||||||||||||||||||||||||||||||||||||||||||||||||||||||||||||||||||||||||||
| PM1 0 | tonnes | 48 896 | -26 | -2 | |||||||||||||||||||||||||||||||||||||||||||||||||||||||||||||||||||||||||||
|
Source:
Emission inventory from Statistics Norway and the
Climate and Pollution Agency. |
The cause of the decrease since 1990 is primarily reduced emissions within manufacturing and mining. Cleaning measures, changes in production procedures and lower activity in some industries have all resulted in reduced emissions. Due to the phasing out of lead-containing petrol, the emissions of lead from road traffic fell dramatically from 1990 to 1996. Fluctuations in emission levels can be affected by uncertainty in measurements.
Reduced emissions of PAH
The PAH emissions decreased from 2008 to 2009, primarily because of the closing down of Soederberg technology in the aluminium production. The emissions from manufacture of iron, steel and ferro alloys also decreased. The time series for PAH emissions from aluminium production have been recalculated for the period 1990 to 2005. The new calculation method, which has been used for all years, includes both particular PAHs and PAHs in gas phase, causing higher emissions for the years before 2005 than previously calculated. There are, however, large annual fluctuations in these calculated emissions. Aluminium production accounted for 17 per cent of the emissions in 2009. The figures for 1990 and 2008 were 67 and 51 per cent respectively. Wood-burning is the most important source of emissions of PAHs and contributed to 46 per cent of the emissions in 2009, compared with 17 and 26 per cent respectively in 1990 and 2008. Other dominant sources are road traffic (12 per cent) and use of solvent-containing products (11 per cent).
Lead emissions are still decreasing
Brake wear is now the dominating source of lead emissions and was responsible for nearly 28 per cent of total lead emissions in 2009. Twenty-four per cent were process emissions, mainly from the production of iron, steel and ferro alloys. The emissions from the production of iron, steel and ferro alloys were reduced by 59 per cent from 2008 to 2009. Use of lead-containing petrol in domestic aviation accounted for 22 per cent of the 2009 lead emissions.
Emissions to air of chromium, arsenic and cadmium greatly reduced
In addition to a strong decrease in lead emissions, chromium, arsenic and cadmium emissions have been reduced by more than 50 per cent since 1990.
Emissions of chromium were 2.9 tonnes in 2009. This is 10 per cent lower than in 2008. Combustion in the wood processing industry is now the most dominant source and contributed with 27 per cent of the total chromium emissions to air in 2009. Emissions of chromium have been reduced by 77 per cent since 1990. The reduction is mainly due to the shutting down of one industrial company. Process emissions from the production of iron, steel and ferro alloys comprised 7 per cent of total chromium emissions in 2009, compared with 63 per cent in 1990.
In 2009, 1.3 tonnes of arsenic were emitted to air. This is a reduction of 26 per cent since 2008. For the past few years, variation in arsenic emissions has been due to varying arsenic content in raw materials and reducing agents used in metal production. The total arsenic emissions have been reduced by 64 per cent since 1990.
Emissions to air of cadmium totalled 490 kg in 2009, which was 18 per cent lower than in 2008. Wood-burning in private households and burning of refuse wood and waste liquor in the wood processing industry are the most important sources of emissions of cadmium to air. In 2009 these sources contributed with 26 and 20 per cent of total emissions respectively. Cadmium emissions have been reduced by 58 per cent since 1990, and the main reason for this is reduced emissions from the production of iron, steel and ferro alloys due to emission reduction efforts and the closing down of production plants. This source was responsible for 4 per cent of cadmium emissions in 2009, compared with 26 per cent in 1990.
Reduced mercury emissions
Mercury emissions have been relatively stable in the period from 2000 to 2007, but have been reduced during the last two years. Emissions were 513 kg in 2009, which is a 15 per cent reduction since 2008. The main reason for the decline is less process emissions from production of iron, steel and ferro alloys. The most important source of mercury emissions is combustion without energy utility, which comprises cremations.
Increasing copper emissions
The emission of copper is now at the same level as in 1990. Emissions decreased at the beginning of the 1990s mainly due to lower emissions from the manufacturing industries. Since 1995 the emissions have increased by 15 per cent due to higher emissions from brake wear and combustion emissions from road traffic caused by increasing traffic. These emissions comprised 44 and 24 per cent of the total copper emissions in 2009 respectively. Another important emissions source is metal production, which was responsible for 12 per cent of emissions in 2009.
Dioxin emissions show strong decrease
In 2009, 21 grams of dioxins were emitted to air. The emissions have been reduced by 83 per cent since 1990. A large proportion of this reduction is due to the shutting down of one industrial plant and one mine. In addition, emissions from energy supply were reduced by 97 per cent from 1990 to 2009 due to the introduction of cleaning measures at waste incineration plants. Since 2005, the emissions have been relatively stable. Since 2008, emissions from the production of iron, steel and ferro alloys have fallen by 29 per cent, while emissions from wood-burning rose by 4 per cent. The most important emission source in 2009 was wood-burning in private households, which caused 36 per cent of total emissions. Combustion emissions from navigation and process emissions from metal production accounted for 20 and 11 per cent respectively of the total.
Emissions of particulate matter are decreasing
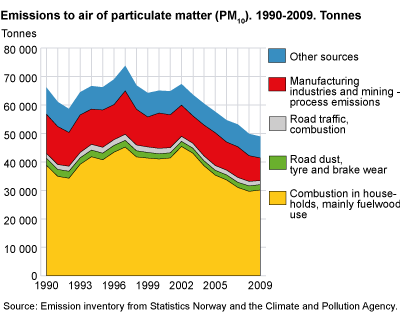
Sixty-two per cent, or about 30 000 tonnes, of the emissions of particulate matter in 2009 came from wood-burning . The wood consumption rose by 4 per cent from 2008 to 2009. At the same time, the calculated emissions of particulate matter from this source rose by only 2 per cent. This is due to a higher share of wood stoves with new technology. Process emissions from manufacturing and mining amounted to 7 700 tonnes, or 16 per cent of the emissions of particulate matter in 2009. Emissions of particulate matter from this source have varied between 8 000 and 15 000 tonnes since 1990. Motor equipment and road dust/tyre wear were responsible for 5 and 4 per cent respectively of the emissions.
Differences between emissions to air and local air qualityParticulate matter in air contributes to poor air quality locally, but can also be transported over great distances. The figures calculated in this statistic are emissions to air, i.e. the amount of particulate matter coming from the chimney, exhaust pipe etc. This is not to be confused with local air quality or concentrations, which is the amount of substances that is actually breathed by humans. In concentration calculations, the fact that humans are more exposed to some emission sources than others is taken into account. For instance, emissions from wood-burning are often emitted from chimneys, and do not affect local air quality to the same extent as exhaust emissions. For this reason, one tonne of particulate matter from wood-burning is less significant to concentrations at ground level than one tonne from exhaust. The health risks associated with local air pollution depend on how high the concentration of the polluting substances is, and on length of exposure. Asthmatics and people with respiratory disorders or cardiovascular diseases are most heavily affected by air pollution in Norway. In addition, children and young people, pregnant women and the elderly are especially sensitive. |
About the emission inventoryAll emission estimates are burdened with some uncertainty. Due to measuring uncertainty in data reported to the Climate and Pollution Agency, the uncertainty is particularly high for reported emissions from parts of the industry. This is partly due to low levels of hazardous substances, which makes accurate measurements challenging. In addition, frequent measurements are essential in order to obtain good estimates when emissions vary with time, and the measurements should often be performed more frequently than what is practically and economically feasible. For more information about the emission calculations, see The Norwegian Emission Inventory 2010. Documentation of methodologies for estimating emissions of greenhouse gases and long-range transboundary air pollutants (Documents 2010/21) Read more about emissions of acidifying substances . Revised emission figures for greenhouse gases will be published on 15 February 2011. |
Tables:
- Table 1 Emissions to air of environmental hazardous substances. 1990-2009. kg. Dioxins in g
- Table 2 Emissions to air of particulate matter, by source. 1990, 2008 and 2009
- Table 3 Emissions to air of particulate matter,by industry. 2009. Tonnes
- Table 4 Emissions to air of hazardous substances, by industry. 2009
The statistics is published with Emissions to air.
Contact
-
Statistics Norway's Information Centre
E-mail: informasjon@ssb.no
tel.: (+47) 21 09 46 42


