Content
Published:
This is an archived release.
Continued growth in municipalities’ GHG emissions
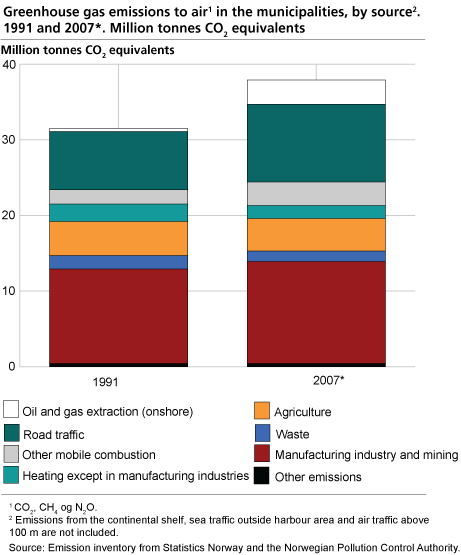
In the period 1991-2007, greenhouse gas emissions increased in 4 out of 5 Norwegian municipalities. Most of the increase is due to traffic growth. Emissions from waste treatment have, on the other hand, decreased, although there has been a considerable growth in waste amounts.
The municipalities’ emissions of carbon dioxide (CO2), methane (CH4) and nitrous oxide (N2O) were 20 per cent higher in 2007 compared with 1991. The total increase in the period equals 6.4 million tonnes of CO2 equivalents. Growth is due to higher emissions from road traffic and other mobile sources, manufacturing industries, onshore oil and gas activity, and other process emissions such as the use of solvents. See text box for more information on the uncertainty and scope of the statistics.
Detailed emission figures for each municipality can be downloaded from the Statbank .
Higher emissions from traffic in almost all municipalities
Traffic growth has been the most important cause of increased emissions in most municipalities. For Norway as a whole, the emissions from road traffic rose from 7.7 million tonnes of CO2 equivalents in 1991 to 10.3 million tonnes in 2007. The growth from 1991 is 35 per cent and from 2006 2.4 per cent.
For approximately half of the municipalities, road traffic was the major cause of greenhouse gas emissions in 2007, and in 97 per cent of the municipalities the emissions from this source were increasing. In the few municipalities where the emissions have decreased since 1991, the reasons are road alterations and depopulation, e. g. emissions from Balestrand and Leikanger have fallen because an important main artery was laid outside these municipalities. It is not possible to distinguish between transit and local traffic in the present emission statistics.
Oslo’s greenhouse gas emissions surpassed by Hammerfest
The start-up of the LNG plant (reception and processing of natural gas) in Hammerfest in 2007 made this municipality the third largest emitter in Norway, surpassing the capital Oslo. Hammerfest, with less than 9 000 inhabitants, was among the Norwegian municipalities with the lowest emissions in the preceding year. Porsgrunn and Lindås have the highest greenhouse gas emissions in Norway. Both these municipalities have major industrial plants.
Emissions from waste disposals more than halved in over 100 municipalities
In 3 out of 4 municipalities, the greenhouse gas emissions from waste were lower in 2007 than in 1991. More than 100 municipalities had reduced the emissions from waste by more than 50 per cent. The total national emissions from waste treatment were reduced from 1.8 million tonnes of CO2 equivalents in 1991 to 1.4 million tonnes in 2007. The reduction has taken place despite a 30 per cent growth in annual generated waste since 1995.
The greenhouse gas methane is formed when organic waste decays in landfills. Waste combustion plants and improved sorting of waste have reduced the amounts of organic waste disposed of in landfills. In addition, recovery and combustion of methane have reduced the emissions. For further reading on waste, see theme page .
Emission growth in the municipalities lower than for national emissions
The municipalities’ emissions of carbon dioxide (CO2), methane (CH4) and nitrous oxide (N2O) grew by 20 per cent in the period 1991-2007. In comparison, the emissions of these three gases rose by 26 per cent for Norway as a whole. The reason for the higher growth in national emissions is that emissions from oil and gas activities on the continental shelf, sea transport (outside harbours) and air traffic above 100 metres are included. Oil and gas activities on the continental shelf have caused most of the increase in total Norwegian greenhouse gas emissions.
Reduced NOX emissions since 1991
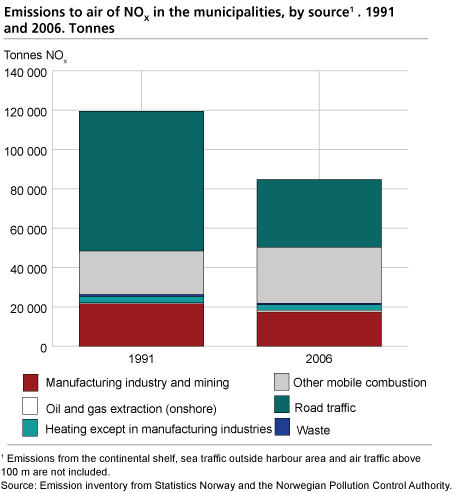
The municipalities’ NOx emissions were reduced by almost 35 000 tonnes (29 per cent) from 1991 to 2006, mainly because of lower emissions from road traffic. While CO2 emissions reflect fuel use, emissions of NOX are also dependent on combustion technology and cleansing. The emissions have been decreasing ever since 1989, when strict exhaust requirements for NOX from petrol vehicles were introduced. NOx emissions from manufacturing industries, heating of buildings and waste combustion were also lower in 2006 compared with 1991. Emissions from mobile combustion other than road traffic, however, grew during the period, as did emissions from onshore oil and gas activity plants.
More documentation on the municipal figures
Read more about greenhouse gas emissions at theme page .
About the municipal figuresThe statistics cover the greenhouse gases carbon dioxide (CO2), methane (CH4) and nitrous oxide (N2O); HFCs, PFCs and SF6 are not included.
The statistics include only three out of six greenhouse gases covered by the Kyoto Protocol. In 2007, these three greenhouse gases contributed to 97 per cent of the total Norwegian emissions of greenhouse gases. The coverage of less than 100 per cent is a marginal source of error for most municipalities. However, for municipalities with industries manufacturing aluminium or magnesium, emissions of other greenhouse gases, namely PFCs and SF6, will have a significant impact on the overall trend. This must be taken into consideration when emission figures are interpreted. Emissions of PFCs and SF6 have been reduced by about 4 million tonnes of CO2-equvivalents at a national level since 1990. In our article, only carbon dioxide, methane and nitrous oxide are included in the collective term greenhouse gases.
All figures on emissions of greenhouse gases published by Statistics Norway are consistent with the requirements of the UN Climate Convention and the Kyoto Protocol. Therefore, foreign shipping and foreign air traffic are not included. The figures for the municipalities are furthermore different from the national figures in that they do not include emissions from oil and gas activities and domestic shipping and fishing outside ports.
In addition to the publication of preliminary figures on greenhouse gas emissions for 2007 and final figures for 2006, updated figures for emissions in municipalities are presented for 1991, 1995, 2000 and 2005. Municipality figures for 1990, which is the base year for the Kyoto protocol, are not available.
Figures for emissions of NOX, SO2, NH3, PM1 0 and NMVOC are also presented.
The quality of the municipal figures will in many cases be poorer than the corresponding emission figures for the whole country. The reason for this is that there is good quality information on, for example, the consumption of different energy carriers at a national level, but less knowledge on how this consumption is distributed between the municipalities or between different emission sources. It should therefore be borne in mind that the figures presented can have many sources of error and are not always able to give a precise picture of the development in a single municipality. The sources of error may bring about striking changes between years in some (primarily minor) municipalities. The effects of local measures may also not be intercepted. |
Annual recalculationAs the emission figures are mainly based on calculations, and thus are not exact values, there is always room for improvement. Research relating to emissions to air is reviewed annually, leading to an annual recalculation of the whole time series. Such modifications are often of less importance for the total emission level in Norway, but may be of great significance for some municipalities. Furthermore, following the recalculations, previously published figures for municipalities are no longer valid and must therefore not be compared with the latest figures. Figures in the tables linked in this web page will always be up to date. |
The statistics is published with Emissions to air.
Contact
-
Statistics Norway's Information Centre
E-mail: informasjon@ssb.no
tel.: (+47) 21 09 46 42


